

Introduction
The Grey partridge Perdix perdix (L., 1958) is a widely-distributed species of Galliformes, and its abundance is steadily declining in most Western and Eastern European countries, as well as in North America (Kuijper et al., 2009; BirdLife International, 2015; Johnsgard, 2017). To date, weather conditions and climate (Potts, 1980; McCrow, 1982; Böhning-Gaese & Lemoine, 2004) are some of the main factors regulating population size and determining the overall range boundaries of birds, including the reintroduced Grey partridge in the United States. At the same time, the effect of the weather on survival of Grey partridge chicks, starting from the moment of their hatching, is well described (Gates, 1973; Panek, 1992; Potts, 2012; Potts, Aebischer, 1995; Kuijper et al., 2009; Aebischer, Ewald, 2012). However, there are few studies focused on the impact of weather and climatic conditions on breeding and the duration and timing of spring and autumn seasonal movements (regional migrations) of Grey partridges. Such studies are extremely rare and only indirectly confirm this linkage (Montagna, Meriggi, 1991). In any case, the Grey partridge is not included in lists of dozens of bird species analyzed from the perspective of the long-term influence of weather and climate on the timing of breeding (reviews: Dunn, Winkler, 2010; Halupka, Halupka, 2017).
Weather conditions, primarily temperature and precipitation, result in significant adjustments to annual fluctuations in the abundance of Grey partridges (Potts, 1970; Panek, 1992; Gaiduk, Abramova, 2009; Faragó et al., 2012; Bro et al., 2014; Gruychev & Angelov, 2019) and may manifest locally and vary in intensity and regional patterns. This can even occur at the country level in Western and Eastern Europe, as continentality increases from west to east (Tryjanowski et al., 2011). Similar geographic variation related to spring weather parameters on the breeding dates of Grey partridges can also be expected to occur latitudinally (Parmesan, 2007). So, in the UK, according to some estimates, low spring temperatures delay the breeding cycle of partridges for a maximum of 3 days (Potts, 1970). Additionally, data obtained in northern Italy indicate that in some years, low spring temperatures significantly delay the start of egg laying and, accordingly, hatching of chicks (Montagna, Meriggi, 1991).
Due to the sedentary nature of Grey partridges in most of their range, in particular in Europe, little is known about the effect of temperature and precipitation on the duration of Grey partridge occurrence in the breeding area and on the timing of their seasonal movements in the autumn period. Meanwhile, data on other European bird groups are ambiguous regarding the impact of climate warming on the duration of their stay in the breeding area. For example, migrants, mainly from the order Passeriformes, arrived earlier in England and the Baltic region during climate warming phases, but also departed earlier in the autumn, thus, the duration of stay in the breeding area did not change significantly (Cotton, 2003; Sokolov, 2006). Other migrants, on the contrary, arrived earlier in warm years and stayed in the breeding area in Central Europe longer than usual (Berthold, 2001).
This research considers the long-term influence of spring, summer, autumn, and winter weather conditions on the dates and duration of stay of family groups of Grey partridge subspecies Perdix perdix robusta (Homeyer et Tancre, 1883) in the Southern Cis-Urals steppe. This subspecies is poorly studied in ecological terms across the entire range. For these purposes, Burtinskaya Steppe, a site managed by Orenburg Nature Reserve, has a large accumulated dataset covering a long-term period.
Burtinskaya Steppe is a breeding ground for Grey partridges. Beginning in June, broods with accompanying adult birds (family groups) are almost exclusively recorded here. Subspecies Perdix perdix robusta, the target of this research, inhabits the study area (Potapov, 1987) and is partially migratory, beginning outmigration in November, presumably to southern regions. In low-snow, warm winters, a small portion of birds may overwinter on site (Barbazyuk, Chibilyov, 2018). It is hypothesized that, starting in the latter half of summer, broods move actively through the site, thanks to its greater biotopic attractiveness. As a result, bird census routes reflect annual abundance of partridges not only in Burtinskaya Steppe, but also in the entire surrounding area.
Materials
Data on Grey partridge abundance in Burtinskaya Steppe were collected between 1992 and 2019 with the exception of 1993. Grey partridge censuses have been and continue to be conducted by a long-serving team of site inspectors, well-trained for censusing.
With an area of 45 km2 (4500 ha), Burtinskaya Steppe is located within the steppe biome of the Orenburg Cis-Urals (ranger station coordinates: 51.228783 N, 56.666500 E), about 30 km north of the border with Kazakhstan (Fig. 1). In 1989, it became part of Orenburg Nature Reserve. The climate is markedly continental with cold, severe winters (average January temperature is -15.8 °С) and dry, hot summers (July +22 °С). Average annual precipitation totals 327 mm. Seasonal snowpack, ranging in height from 10 to 120 cm, remains in place from approximately December to late March. The site lies within a forb-fescue-feathergrass (true) steppe subzone with southern chernozem soils. The site is hilly open steppe with small birch-aspen groves along the folds of the hills and black alder groves in the floodplains of streams. The maximum absolute elevation of the Muyuldy Plateau in the center of the site is 420.9 meters above sea level (Chibilyov, 2014). Burtinskaya Steppe is surrounded by treeless lowland pastures and agricultural land, much of which is fallow.
Methods
Bird census routes use field roads that cross intact steppe landscapes through the breeding and feeding grounds of partridges. Bird census routes use field roads that cross intact steppe landscapes through the breeding and feeding grounds of partridges. In addition, censuses were carried out around the entire perimeter of the site, delineated by a plowed firebreak. The entire site has a strict access control regime, and only patrol vehicles use the field roads.
Intensive partridge censuses on the main and secondary routes were a combination of roadside censuses and stops at established observation points (ranger station, Kaynar Spring, and Beloglinka and Tavolgasay Dam) (Fig. 1). The perimeter was examined several times each season during plowing round the site. This census regime is unchanged and continues to this day. The author’s own long-term observations in Burtinskaya Steppe showed that little-visited field roads and the reserve’s plowed firebreak used as census routes were sites that attract coveys of Grey partridges. Perhaps this was due to the greater availability of food along roads, better visibility and management of the brood by adults, and safer living conditions from the perspective of timely detection of ground predators (increased detection distance).
All the data obtained for this study are presented in two sets. The first dataset includes only the main census route with a length of 14.9 km (Fig. 1). This route was fully traveled 3–5 times a week from early spring to the end of the year. The second dataset consists of data from the main route plus data from secondary field roads (surveyed in sections 3–5 times each week, total length 12.3 km), data from the entire site perimeter (a full day census is carried out 2–3 times per year, total length 33.5 km), and data from other parts of Burtinskaya Steppe (incidental encounters). In winter, the number of visits to the reserve is reduced to a few times per month. Thus, the first dataset only includes sightings along the main route, and the second dataset includes all available sightings in Burtinskaya Steppe. Most of sightings occurred on the main route. However, in some years, data from other locations supplemented and clarified the overall picture of the presence of partridges at the site, for example, significantly expanding the temporal range of partridge sightings due to isolated earlier or later sightings on the periphery of the Burtinskaya Steppe site. The report designates these 2 datasets separately under the names ‘route’ and ‘site’.
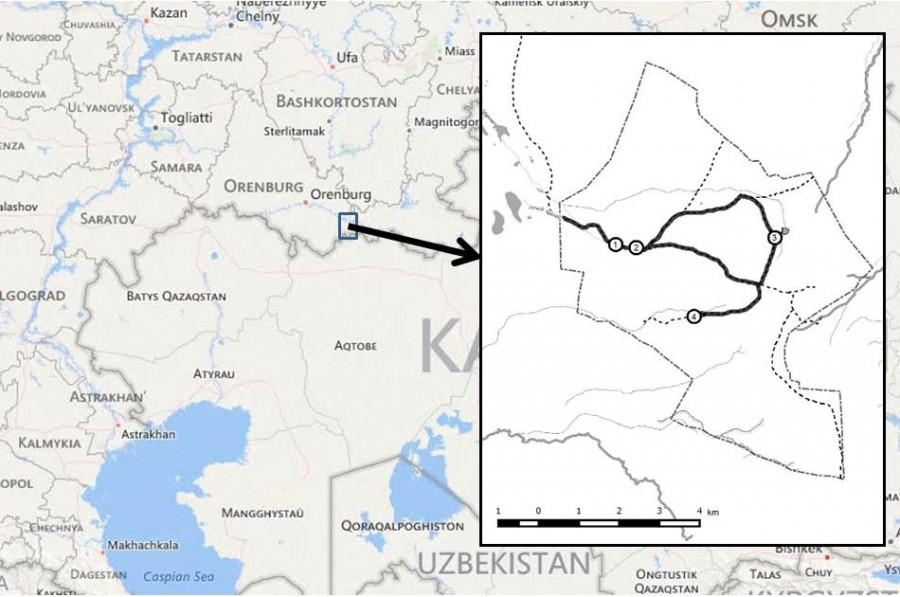
Fig. 1. Study area: Burtinskaya Steppe, Orenburg Nature Reserve, Southern Cis-Urals, Russia. Thick black line indicates the primary main road route with stops (length 14.9 km); dotted line represents the boundaries of Burtinskaya Steppe, or the perimeter (33.5 km), and secondary road routes within its boundaries (12.3 km). Stops on the main route: 1 – ranger station, 2 – Kaynar Spring, 3 – Beloglinka Dam, 4 – Tavolgasay Dam
The width of the census strip did not exceed 100 meters, approximately 50 meters in each direction from the road. Birds were censused on the ground or in the air when family groups were flushed from the road, firebreak, or at a waypoint. The following parameters were recorded: number of individuals (singles, pairs, or groups of more than 2 birds), the date, time, and place of occurrence, if possible, gender, age, condition of juveniles (ability to run or flush up, downy or feathered). In winter months, partridge tracks on the snow and their number were additionally recorded. A single census day could total 1–3 or more sightings of partridges. In total, during the period 1992-2019, there were 1332 sightings of Grey partridges in Burtinskaya Steppe, including single birds in the spring, flocks in the winter season, and bird tracks on the snow. This article focuses on the timing of Grey partridge occurrences in Burtinskaya Steppe rather than on bird abundance. However, to characterize overall population dynamics over a long-term period, the average number of birds from June to December is provided, based on daily family group sightings on the route and on the entire site, calculated per square kilometer of the total area of Burtinskaya Steppe.
Correlation analysis was used exclusively in this study. Because the assumption for a normal distribution of partridge sighting dates was not true, the nonparametric Spearman rank correlation coefficient was used.
Within a single year, sightings of partridges were analyzed for two periods – June–November and June–December – corresponding to the initial appearance of broods and the end of autumn and year. Another analyzed period was a complete interannual cycle of sightings of partridge family groups in Burtinskaya Steppe: June–April in the following year (until the end of the cycle), i.e. until the complete cessation of family group sightings in the study area (the May gap) and the beginning of sightings of new family groups in June.
When constructing linear regressions of meteorological parameters and other variables with a regression (B) coefficient, the distribution of trend residuals for normality was verified using chi-square and Kolmogorov-Smirnov tests, and the absence of autocorrelation in the residuals, in particular, by the Darbin-Watson test for time series. Nonparametric correlation analysis and regression construction were performed using Statistica 10 software.
Daily meteorological data for the period 1992–2019 were obtained from the nearest Orenburg government weather station located in Belyaevka village, about 25 km northwest of Burtinskaya Steppe.
The Selyaninov hydrothermal coefficient (HTC) was used to assess the effects of drought on Grey partridge sighting dates. This coefficient is a Russian quantitative indicator for drought and is a close analogue to the Standardized Precipitation Index (SPI) and Standardized Precipitation Evapotranspiration Index (SPEI) (Cherenkova, Zolotokrylin, 2016). The Selyaninov hydrothermal coefficient is a relative indicator for an area’s moisture level, i.e., the ratio of precipitation (R, in mm) and average air temperature over 10°С (T>10℃) to the sum of average daily temperatures, reduced 10 times over the same period:

HTC, characterizing the ratio of heat and moisture, was calculated by selecting average daily air temperatures above 10°C and daily precipitation on each of these dates in each month from May to August, over the 28-year study period. To simplify assessment of the moisture regime (or drought intensity) of the vegetation period, G.T. Selyaninov defined HTC values of < 1.0 to be the dry period and < 0.5 for the absolute dry period (Gringof, Pavlova, 2013).
Results
Long-term changes in mean air temperature, precipitation, and hydrothermal coefficient
In general, it can be said that over the study period, average air temperature increased, and total precipitation and HTC declined. However, the trends were not uniform. When analyzing changes in mean temperature for specific seasons, only summer temperatures (y = -145.899 + 0.0832x, B = 0.44, R2 = 0.19, F1,26 = 6.13, p = 0.020, n = 28; normal residual distribution, DW = 1.89: no autocorrelation) and spring temperatures (y = -189.694 + 0.0973x, B = 0.39, R2 = 0.15, F1,26 = 4.55, p = 0.04, n = 28; normal residual distribution, DW = 2.66: autocorrelation not defined) demonstrated linear growth (Fig. 2). The strongest relationship between mean air temperature and time occurred when combining several periods of the year; maximal coupling occurred in April – October (y = -118.9085 + 0.0667x, B = 0.50, R2 = 0.24, F1,26 = 8.39, p = 0.008, n = 28; normal residual distribution, DW = 1.77: no autocorrelation). Linear dependence of precipitation on time in spring and autumn was not recorded (Fig. 2) and was found to be significant only in June–August (y = 125.1675 - 2.5103x, B = -0.40, R2 = 0.16, F1,26 = 4.82, p = 0.04, n = 28; normal residual distribution, DW = 1.81: no autocorrelation). In 1992 – 2019, HTC values steadily declined over the entire calculated period, i.e. from May to August (y = 118.3481 - 0.0579x, B = -0.38, R2 = 0.15, F1,26 = 4.49, p = 0.04, n = 28; normal residual distribution, DW = 2.12: no autocorrelation) (Fig. 2).
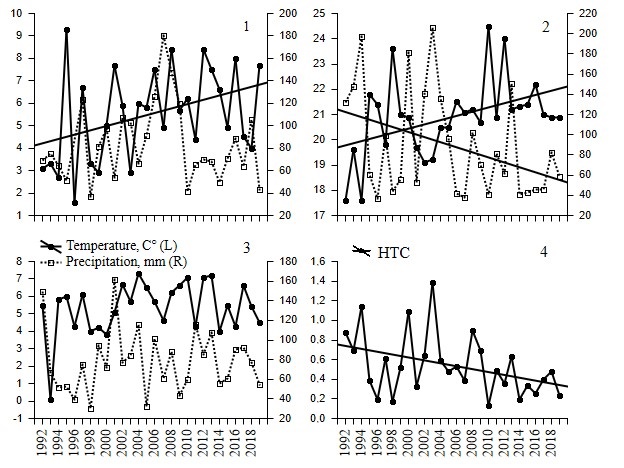
Fig. 2. Mean air temperature (С°) on left axis and precipitation (mm) on right axis March – May (1), June–August (2), September–November (3), and also HTC May–August (4) in 1992–2019 in Burtinskaya Steppe, Orenburg Nature Reserve. Trend is shown for significant linear regressions
Distribution of bird sightings by month, changes in mean density of birds and mean date of family group sightings
In 1992–2019 Grey partridges were generally encountered year-round in Burtinskaya Steppe. In April and May mostly single and paired birds were recorded. In June, the first broods appeared. The number of family group sightings (broods with adults) increased through October, falling sharply in November and December as birds departed the site. In some warm years, small groups of partridges (presumably fully grown broods) remained until February–March, including two instances where broods remained through the first part of April. In May, family groups were absent (Fig. 3). After the appearance of the first broods, single birds and pairs were recorded only rarely. These were trauma-mimicking individuals diverting danger away from nests and chicks, or were perhaps individuals otherwise associated with family groups.
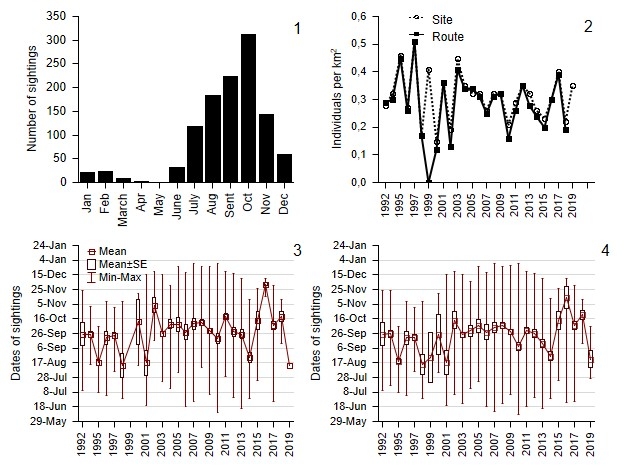
Fig. 3. Annual distribution of family group sightings (January–December) for the entire site (1). Average bird density per square kilometer on the route and the entire site from June to December (2). Dates of family group sightings on the route from June to December (3). Dates of family group sightings for the entire site June–December (4). Census data in Burtinskaya Steppe, Orenburg Nature Reserve, 1992–2019.
The mean density of Grey partridges in Burtinskaya Steppe in terms of site area varied greatly year to year from 0 (1999) to 0.51 ± 0.08 (1997) individuals/km2 on the route and from 0.15 ± 0.03 (2000) to 0.51 ± 0.08 (1997) individuals/km2 throughout the site. The maximum discrepancy in the number of birds on the route and for the entire site occurred in 1999, when no birds were documented on the route, and only two family groups were encountered outside it. In 2019, only a single observation of a family group of 18 birds was recorded on the route, while the mean number for the entire site was 15.6 ± 2.46 (n = 5), or 0.35 ± 0.05 individuals/km2 (Fig. 3). Notably, there was a weak downward, statistically non-significant linear dynamic for the mean density of Grey partridges in Burtinskaya Steppe.
During the study period, the mean date of Grey partridge sightings by the end of the calendar year varied between August 13 (1998) and December 2 (2016) on the route and between August 14 (1998) and November 14 (2016) for the entire site (Fig. 3). As stated above, no birds were recorded in 1999 on the route, and only one family group was recorded here on 13 August 2019 (Fig. 3). For the site overall, birds were encountered in all years, and there was always more than one family group sighting each year (Fig. 3).
Influence of spring-summer temperatures, precipitation, and HTC on the mean and median date of family group sightings
Tables 1 and 2 show the correlations of meteorological parameters for various periods with the mean date and median date of Grey partridge family group sightings on the route and throughout the site until November (the end of autumn) and until December (the end of the calendar year).
Table 1. Spearman’s rank correlations between mean air temperature, precipitation and HTC and the mean date of family group sightings on the route (n = 26) and for the entire site (n = 27) until the end of November and the year. Census data in Burtinskaya Steppe, Orenburg Nature Reserve, 1992–2019
| Mean date of sightings, days since June until | Period | ||||||||||||||
| Apr | Apr– May | Apr–Jun | Apr–Jul | Apr-Aug | May | May–Jun | May–Jul | May-Aug | Jun | Jun–Jul | Jun–Aug | Jul | Jul–Aug | Aug | |
| year end | Mean air temperature (С°) | ||||||||||||||
| Route | 0.15 | -0.13 | -0.28 | -0.17 | -0.12 | -0.34 | -0.46 | -0.32 | -0.24 | -0.42 | -0.19 | -0.12 | 0.08 | 0.06 | 0.08 |
| Site | -0.03 | -0.10 | -0.23 | -0.15 | -0.13 | -0.20 | -0.32 | -0.23 | -0.14 | -0.40 | -0.18 | -0.12 | -0.01 | -0.01 | 0.00 |
| end of November | |||||||||||||||
| Route | 0.01 | -0.30 | -0.42 | -0.34 | -0.30 | -0.51 | -0.55 | -0.43 | -0.35 | -0.48 | -0.25 | -0.21 | -0.02 | -0.02 | -0.05 |
| Site | -0.14 | -0.26 | -0.39 | -0.33 | -0.30 | -0.36 | -0.44 | -0.37 | -0.27 | -0.49 | -0.28 | -0.21 | -0.10 | -0.01 | -0.06 |
| year end | Precipitation (mm) | ||||||||||||||
| Route | 0.31 | 0.57 | 0.59 | 0.47 | 0.45 | 0.39 | 0.48 | 0.37 | 0.39 | 0.47 | 0.28 | 0.23 | -0.06 | 0.01 | -0.05 |
| Site | 0.37 | 0.56 | 0.52 | 0.38 | 0.39 | 0.35 | 0.36 | 0.26 | 0.34 | 0.31 | 0.13 | 0.15 | -0.08 | 0.01 | -0.01 |
| end of November | |||||||||||||||
| Route | 0.23 | 0.52 | 0.56 | 0.52 | 0.49 | 0.38 | 0.44 | 0.44 | 0.43 | 0.46 | 0.41 | 0.30 | 0.13 | 0.15 | -0.06 |
| Site | 0.25 | 0.53 | 0.54 | 0.49 | 0.46 | 0.41 | 0.38 | 0.39 | 0.40 | 0.37 | 0.32 | 0.21 | 0.15 | 0.11 | -0.10 |
| year end | HTC | ||||||||||||||
| Route | - | - | - | - | - | 0.34 | 0.46 | 0.33 | 0.36 | 0.49 | 0.30 | 0.24 | -0.07 | 0.04 | -0.07 |
| Site | - | - | - | - | - | 0.28 | 0.33 | 0.22 | 0.27 | 0.32 | 0.15 | 0.15 | -0.08 | 0.03 | -0.03 |
| end of November | |||||||||||||||
| Route | - | - | - | - | - | 0.37 | 0.46 | 0.44 | 0.42 | 0.48 | 0.41 | 0.31 | 0.12 | 0.17 | -0.06 |
| Site | - | - | - | - | - | 0.39 | 0.38 | 0.37 | 0.35 | 0.38 | 0.31 | 0.23 | 0.15 | 0.13 | -0.10 |
Note. The mean date of sightings was calculated from June 1 to the end of the calendar year (June–December – 214 days) and from June 1 to the end of autumn (June–November – 183 days). Correlations marked in bold are significant at р ˂ 0.05, and correlations marked in bold and italics are significant at р ˂ 0.01 (same for Table 2)
Table 2. Spearman’s rank correlations of mean air temperature, precipitation and HTC with median date of family group sightings on the route (n = 26) and throughout the site (n = 27) until the end of November and the year. Census data in Burtinskaya Steppe, Orenburg Nature Reserve, 1992–2019
| Median date of records, days since June until | Period | ||||||||||||||
| Apr | Apr– May | Apr–Jun | Apr–Jul | Apr-Aug | May | May–Jun | May–Jul | May-Aug | Jun | Jun–Jul | Jun–Aug | Jul | Jul–Aug | Aug | |
| year end | Mean air temperature (С°) | ||||||||||||||
| Route | 0.28 | -0.08 | -0.13 | -0.06 | -0.01 | -0.37 | -0.33 | -0.22 | -0.13 | -0.23 | -0.01 | 0.05 | 0.16 | 0.18 | 0.18 |
| Site | -0.03 | -0.14 | -0.23 | -0.17 | -0.16 | -0.30 | -0.30 | -0.27 | -0.16 | -0.35 | -0.17 | -0.08 | -0.06 | -0.01 | 0.01 |
| end of November | |||||||||||||||
| Route | 0.20 | -0.14 | -0.20 | -0.13 | -0.09 | -0.44 | -0.39 | -0.29 | -0.20 | -0.28 | -0.07 | -0.03 | 0.08 | 0.12 | 0.11 |
| Site | -0.07 | -0.21 | -0.30 | -0.25 | -0.23 | -0.37 | -0.36 | -0.33 | -0.23 | -0.39 | -0.23 | -0.14 | -0.11 | -0.05 | -0.05 |
| year end | Precipitation (mm) | ||||||||||||||
| Route | 0.31 | 0.44 | 0.49 | 0.42 | 0.37 | 0.33 | 0.40 | 0.36 | 0.28 | 0.40 | 0.29 | 0.16 | -0.01 | -0.04 | -0.13 |
| Site | 0.37 | 0.57 | 0.53 | 0.44 | 0.40 | 0.42 | 0.38 | 0.34 | 0.33 | 0.29 | 0.17 | 0.11 | -0.03 | -0.02 | -0.09 |
| end of November | |||||||||||||||
| Route | 0.23 | 0.46 | 0.48 | 0.46 | 0.41 | 0.32 | 0.35 | 0.38 | 0.32 | 0.33 | 0.31 | 0.19 | 0.09 | 0.06 | -0.11 |
| Site | 0.25 | 0.59 | 0.56 | 0.48 | 0.44 | 0.44 | 0.39 | 0.37 | 0.36 | 0.29 | 0.21 | 0.13 | 0.03 | 0.02 | -0.10 |
| year end | HTC | ||||||||||||||
| Route | - | - | - | - | - | 0.27 | 0.38 | 0.32 | 0.27 | 0.41 | 0.27 | 0.13 | -0.02 | -0.04 | -0.15 |
| Site | - | - | - | - | - | 0.35 | 0.36 | 0.31 | 0.29 | 0.30 | 0.17 | 0.10 | -0.02 | -0.01 | -0.10 |
| end of November | |||||||||||||||
| Route | - | - | - | - | - | 0.31 | 0.37 | 0.37 | 0.32 | 0.35 | 0.29 | 0.17 | 0.09 | 0.06 | -0.12 |
| Site | - | - | - | - | - | 0.38 | 0.38 | 0.36 | 0.32 | 0.30 | 0.20 | 0.13 | 0.04 | 0.04 | -0.10 |
When considering the influence of mean air temperature on dates of family group sightings through the end of autumn and the year, the key period was May–June. Increased mean temperatures in May–June contributed to an earlier mean date of partridge sightings in the reserve. Conversely, a cooler May – June shifted the mean date of sightings later in the year (Table 1). Stricter values were obtained for the median (Table 2).
The most important period in terms of the influence of precipitation on the mean and median dates of partridge sightings was the period from mid-spring to early summer: April–June. It was during this period that the highest and most significant positive correlation of precipitation with the mean date of sightings of partridge family groups in Burtinskaya Steppe was observed. A rainy mid-spring and early summer led to a shift in the mean date of family group sightings of partridges to a later period. In the table, starting from the April–May period, the significance and value of the correlation decrease from left to right. It is clear that without that spring period, summer precipitation amounts cease to correlate with the mean date of sightings (Table 1). This is especially evident in the example of the median (Table 2).
When considering the influence of the hydrothermal coefficient on sighting dates of partridge family groups, May–July stood out as a critical period. As in the case of precipitation, increased moisture in May–July led to a shift in the mean date of family group sightings to a later period (Table 1). When analyzing the correlation of the median date of sightings with the hydrothermal coefficient, only June was significant. May correlation values very slightly missed the significance level of 0.05 (Table 2).
Influence of temperature, precipitation and the hydrothermal coefficient on the temporal range of sightings, and also on the number of family group sightings June – July and November – December
The graph (Fig. 3) shows a slight expansion of the temporal range of sightings in the period from 2001 to 2013, as a result of increased family group sightings in early June and late November and the occurrence of December sightings. During the study period 1992–2019, December family group sightings began in 2001 and continued through 2013. Subsequently, December sightings have occurred only once, in 2016.
Some connection between temporal range and temperature can be traced. The temporal range of sightings on the route through the end of autumn (June–November) is positively correlated with mean air temperature for the same period (R = 0.46, p = 0.021, n = 25). The relationship between the temporal range of sightings throughout the site until the end of autumn (June–November) and the mean air temperature for the same period is only slightly non-significant (R = 0.38, p = 0.052, n = 27). During other periods (June–December, June–April) the correlation was low and non-significant. The relationship between the sighting range and precipitation for various periods of the year was also low and non-significant.
The expansion of the temporal range of sightings in periods with increased mean air temperature is confirmed by a significant positive relationship between the number of family group sightings in June–July and temperatures in these and previous periods and by a positive relationship between the number of sightings in November–December and temperatures in these and previous periods (Table 3). From the time that family groups first appear, the best result was a positive correlation of mean temperatures in May–June with the number of sightings in June – July on the route: R = 0.52, p = 0.0052, n = 27 (Table 3). In November, the number of sightings was also higher if autumn was warm. The most significant relationship was recorded between the mean temperature in September–November and the number of sightings across the entire site in November–December: R = 0.44, p = 0.023, n = 27 (Table 3).
Table 3. Spearman’s rank correlations of mean air temperature with the number of family group sightings for shoulder periods of the temporal range (June–July, November–December) through year end on the route (n = 27) and for the entire site (n = 27). Census data in Burtinskaya Steppe, Orenburg Nature Reserve, 1992–2019
| Temperature | Number of sightings: route/site | ||||
| June | June–July | November | November–December | December | |
| April | 0.07/0.14 | -0.02/0.11 | - | - | - |
| April–May | 0.26/0.31 | 0.28/0.42 | - | - | - |
| April–June | 0.29/0.20 | 0.39/0.42 | - | - | - |
| April–July | - | 0.31/0.39 | - | - | - |
| May | 0.26/0.20 | 0.41/0.45 | - | - | - |
| May–June | 0.32/0.12 | 0.52/0.44 | - | - | - |
| May–July | - | 0.43/0.42 | - | - | - |
| June | 0.24/0.01 | 0.42/0.31 | - | - | - |
| June–July | - | 0.27/0.25 | - | - | - |
| September | - | - | 0.36/0.38 | 0.33/0.37 | 0.16/0.25 |
| September–October | - | - | 0.15/0.21 | 0.14/0.21 | 0.17/0.24 |
| September–November | - | - | 0.40/0.41 | 0.41/0.44 | 0.34/0.41 |
| September–December | - | - | - | 0.20/0.22 | 0.04/0.10 |
| October | - | - | -0.15/-0.09 | -0.17/-0.12 | -0.02/-0.02 |
| October–November | - | - | 0.26/0.27 | 0.27/0.29 | 0.25/0.30 |
| October–December | - | - | - | 0.24/0.23 | 0.10/0.15 |
| November | - | - | 0.38/0.37 | 0.41/0.41 | 0.31/0.36 |
| November–December | - | - | - | 0.23/0.21 | 0.03/0.07 |
| December | - | - | - | - | -0.17/-0.16 |
Note. Correlations marked in bold are significant at р ˂ 0.05, and correlations marked in bold and italics are significant at р ˂ 0.01. The same is true for Table 4.
Against the backdrop of a weak relationship between the temporal range of sightings with precipitation for the entire observation period in 1992–2019, precipitation negatively affected the number of partridge sightings only at the beginning of the brood season (Table 4). For example, increased precipitation in April–May resulted in a decline in the number of partridge sightings in June–July on both the route (R = -0.40, p = 0.037, n = 27) and throughout the site (R = -0.43, p = 0.023, n = 27). Autumn precipitation did not significantly affect the number of partridge sightings in this period. The negative relation of precipitation with the number of family group sightings increases in December (R = -0.26 on the route and R = -0.23 for the entire site), but remains non-significant (Table 4).
Table 4. Spearman’s rank correlations for precipitation with the number of family group sightings for shoulder time periods (June–July, November–December) through year end on the route (n = 27) and for the entire site (n = 27). Census data in Burtinskaya Steppe, Orenburg Nature Reserve, 1992–2019
| Precipitation | Number of sightings: route/site | ||||
| June | June–July | November | November–December | December | |
| April | -0.01/-0.06 | -0.23/-0.26 | - | - | - |
| April–May | -0.30/-0.16 | -0.40/-0.43 | - | - | - |
| April–June | -0.31/-0.11 | -0.36/-0.32 | - | - | - |
| April–July | - | -0.41/-0.33 | - | - | - |
| May | -0.28/-0.13 | -0.22/-0.25 | - | - | - |
| May–June | 0.32/-0.12 | -0.26/-0.21 | - | - | - |
| May–July | - | -0.35/-0.25 | - | - | - |
| June | -0.34/-0.09 | -0.26/-0.16 | - | - | - |
| June–July | - | -0.39/-0.24 | - | - | - |
| September | - | - | 0.11/0.04 | 0.20/0.14 | 0.22/0.22 |
| September–October | - | - | 0.18/0.12 | 0.21/0.17 | 0.12/0.15 |
| September–November | - | - | 0.21/0.19 | 0.24/0.21 | 0.13/0.18 |
| September–December | - | - | - | -0.01/-0.04 | -0.06/-0.01 |
| October | - | - | 0.15/0.15 | 0.15/0.16 | 0.03/0.08 |
| October–November | - | - | 0.15/0.18 | 0.14/0.15 | 0.01/0.06 |
| October–December | - | - | - | -0.17/-0.17 | -0.22/-0.17 |
| November | - | - | -0.07/-0.01 | -0.01/0.01 | 0.06/0.08 |
| November–December | - | - | - | -0.27/-0.25 | -0.18/-0.15 |
| December | - | - | - | - | -0.26/-0.23 |
Linear dependencies of mean date, median date and temporal range of sightings on time and weather parameters in various time periods
The revealed weak linear dependencies of the studied parameters on time and temperature are the result of the phenomena described above, primarily, probably steadily increasing temperature.
The linear dependence of the mean and median dates of sightings over time increases when considering these time segments: June–November (through the end of autumn), June–December (until year end) and becomes significant in June–April (until the end of the cycle). The regression coefficient was significant only for the mean sighting date over the entire site: B = 0.43, R2 = 0.18, F1,23 = 5.20, p = 0.03, n = 25 (normal residual distribution, DW = 1.96: no autocorrelation) and for the median sighting date over the entire site B = 0.46, R2 = 0.21, F1,23 = 6.07, p = 0.02, n = 25 (normal residual distribution, DW = 2.10: no autocorrelation). For other periods, the linear regression coefficient only very slightly missed the 0.05 significance level (Fig. 4, Table 5).
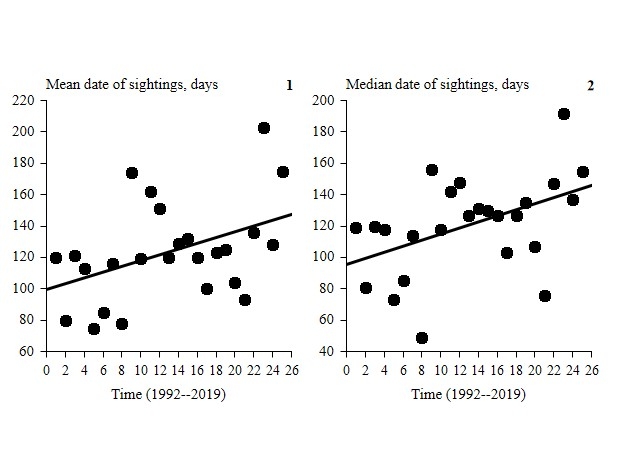
Fig. 4. Linear dependence of mean (1) and median (2) sighting dates on time, June–April (until the end of the cycle) for the entire site. Average and median sighting dates were calculated from June 1 to April 30 of the following year (until the end of family group sightings). Census data in Burtinskaya Steppe, Orenburg Nature Reserve, 1992–2019.
At the same time, the linear dependence of the temporal range of sightings year to year during various periods was not confirmed. It was found to be weak and non-significant (Table 5). The linear relationship between the mean date of sightings and average air temperature was also weak and non-significant (Table 5); similar results were obtained for the median date. The linear relationship between the temporal range of sightings and temperature declined through autumn and winter; in other words, by the end of the cycle the influence of temperature on the temporal range of sightings dropped sharply by winter and beyond. The linear regression coefficient was significant only for the pair of variables ‘temporal range of sightings until year end on route & temperature’ (B = 0.44, R2 = 0.19, F1,23 = 5.51, p = 0.03, n = 25) (Table 5).
There was no linear relationship between the mean date of sightings and precipitation at various periods of the season (Table 5). Similar values were obtained for the median date of sightings. There was no linear relationship between precipitation and the temporal range of sightings for all segments of the season (Table 5). As with precipitation, there was no linear relationship between HTC and the mean date of sightings, or between HTC and the temporal range of sightings (Table 5).
Table 5. Several linear regressions describing the influence of meteorological parameters (mean temperature, precipitation, HTC) and time T (years) on the mean date, median date, and temporal range of Grey partridge family group sightings on the route and over the entire site for various periods of the season. Census data in Burtinskaya Steppe, Orenburg Nature Reserve, 1992–2019
| Linear regression (dependent and independent variables) | Statistics |
| Mean date of sightings until end of November on route & time T | B = 0.27, R2 = 0.07, F1,24 = 1.91, p = 0.18, n = 26 |
| Mean date of sightings until end of November on site & time T | B = 0.31, R2 = 0.10, F1,25 = 2.72, p = 0.11, n = 27 |
| Mean date of sightings until year end on route & time T | B = 0.25, R2 = 0.06, F1,24 = 1.62, p = 0.22, n = 26 |
| Mean date of sightings until year end on site & time T | B = 0.33, R2 = 0.11, F1,25 = 3.08, p = 0.09, n = 27 |
| Mean date of sightings until end of cycle on route & time T | B = 0.37, R2 = 0.14, F1,22 = 3.57, p = 0.07, n = 24 |
| Mean date of sightings until end of cycle on site & time T | B = 0.43, R2 = 0.18, F1,23 = 5.20, p = 0.03, n = 25 |
| Median date of sightings until end of November on route & time T | B = 0.26, R2 = 0.07, F1,24 = 1.69, p = 0.21, n = 26 |
| Median date of sightings until end of November on site & time T | B = 0.30, R2 = 0.09, F1,25 = 2.52, p = 0.12, n = 27 |
| Median date of sightings until year end on route & time T | B = 0.27, R2 = 0.07, F1,24 = 1.89, p = 0.18, n = 26 |
| Median date of sightings until year end on site & time T | B = 0.33, R2 = 0.11, F1,25 = 3.06, p = 0.09, n = 27 |
| Median date of sightings until end of cycle on route & time T | B = 0.35, R2 = 0.13, F1,22 = 3.17, p = 0.09, n = 24 |
| Median date of sightings until end of cycle on site & time T | B = 0.46, R2 = 0.21, F1,23 = 6.07, p = 0.02, n = 25 |
| Temporal range of sightings until end of November on route & time T | B = 0.09, R2 = 0.01, F1,23 = 0.18, p = 0.68, n = 25 |
| Temporal range of sightings until end of November on site & time T | B = 0.17, R2 = 0.03, F1,25 = 0.75, p = 0.40, n = 27 |
| Temporal range of sightings until year end on route & time T | B = 0.10, R2 = 0.01, F1,23 = 0.23, p = 0.64, n = 25 |
| Temporal range of sightings until year end on site & time T | B = 0.15, R2 = 0.02, F1,25 = 0.55, p = 0.46, n = 27 |
| Temporal range of sightings until end of cycle on route & time T | B = 0.21, R2 = 0.04, F1,22 = 0.99, p = 0.33, n = 24 |
| Temporal range of sightings until end of cycle on site & time T | B = 0.16, R2 = 0.03, F1,24 = 0.66, p = 0.42, n = 26 |
| Mean date of sightings until end of November on route & temperature | B = -0.01, R2 = 0.00, F1,24 = 0.01, p = 0.94, n = 26 |
| Mean date of sightings until end of November on site & temperature | B = -0.01, R2 = 0.00, F1,25 = 0.00, p = 0.95, n = 27 |
| Mean date of sightings until year end on route & temperature | B = -0.15, R2 = 0.02, F1,24 = 0.58, p = 0.45, n = 26 |
| Mean date of sightings until year end on site & temperature | B = -0.16, R2 = 0.03, F1,25 = 0.69, p = 0.41, n = 27 |
| Mean date of sightings until end of cycle on route & temperature | B = -0.17, R2 = 0.03, F1,22 = 0.64, p = 0.43, n = 24 |
| Mean date of sightings until end of cycle on site & temperature | B = -0.19, R2 = 0.03, F1,23 = 0.82, p = 0.38, n = 25 |
| Temporal range of sightings until end of November on route & temperature | B = 0.39, R2 = 0.15, F1,23 = 4.03, p = 0.06, n = 25 |
| Temporal range of sightings until end of November on site & temperature | B = 0.33, R2 = 0.11, F1,25 = 3.07, p = 0.09, n = 27 |
| Temporal range of sightings until year end on route & temperature | B = 0.44, R2 = 0.19, F1,23 = 5.51, p = 0.03, n = 25 |
| Temporal range of sightings until year end on site & temperature | B = 0.18, R2 = 0.03, F1,25 = 0.80, p = 0.38, n = 27 |
| Temporal range of sightings until end of cycle on route & temperature | B = 0.15, R2 = 0.02, F1,22 = 0.48, p = 0.49, n = 24 |
| Temporal range of sightings until end of cycle on site & temperature | B = -0.12, R2 = 0.01, F1,23 = 0.33, p = 0.57, n = 25 |
| Mean date of sightings until end of November on route & precipitation | B = 0.20, R2 = 0.04, F1,24 = 1.05, p = 0.32, n = 26 |
| Mean date of sightings until end of November on site & precipitation | B = 0.15, R2 = 0.02, F1,25 = 0.59, p = 0.45, n = 27 |
| Mean date of sightings until year end on route & precipitation | B = 0.18, R2 = 0.03, F1,24 = 0.83, p = 0.37, n = 26 |
| Mean date of sightings until year end on site & precipitation | B = 0.10, R2 = 0.01, F1,25 = 0.27, p = 0.61, n = 27 |
| Mean date of sightings until end of cycle on route & precipitation | B = 0.08, R2 = 0.01, F1,22 = 0.15, p = 0.71, n = 24 |
| Mean date of sightings until end of cycle on site & precipitation | B = 0.06, R2 = 0.00, F1,23 = 0.08, p = 0.78, n = 25 |
| Temporal range of sightings until end of November on route & precipitation | B = -0.13, R2 = 0.02, F1,23 = 0.40, p = 0.53, n = 25 |
| Temporal range of sightings until end of November on site & precipitation | B = 0.08, R2 = 0.01, F1,25 = 0.18, p = 0.68, n = 27 |
| Temporal range of sightings until year end on route & precipitation | B = -0.18, R2 = 0.03, F1,23 = 0.79, p = 0.38, n = 25 |
| Temporal range of sightings until year end on site & precipitation | B = 0.00, R2 = 0.00, F1,25 = 0.00, p = 0.99, n = 27 |
| Temporal range of sightings until end of cycle on route & precipitation | B = -0.05, R2 = 0.00, F1,22 = 0.06, p = 0.81, n = 24 |
| Temporal range of sightings until end of cycle on site & precipitation | B = -0.02, R2 = 0.00, F1,23 = 0.01, p = 0.93, n = 25 |
| Mean date of sightings until end of November on route & HTC | B = 0.26, R2 = 0.07, F1,24 = 1.73, p = 0.20, n = 26 |
| Mean date of sightings until end of November on site & HTC | B = 0.30, R2 = 0.09, F1,25 = 2.40, p = 0.13, n = 27 |
| Temporal range of sightings until end of November on route & HTC | B = -0.17, R2 = 0.03, F1,23 = 0.69, p = 0.41, n = 25 |
| Temporal range of sightings until end of November on site & HTC | B = 0.03, R2 = 0.00, F1,25 = 0.02, p = 0.90, n = 27 |
Note. p-values marked in bold approach p = 0.05, and those marked in bold and italics correspond to the level of р ˂ 0.05
Discussion
The findings indicate that Grey partridges (Perdix perdix robusta subspecies) respond to both temperature and precipitation in the first half of the breeding season. Hot weather in May–June facilitates occurrences of broods in Burtinskaya Steppe, accelerating the entire reproductive process: earlier egg laying, earlier hatching. Conversely, increased precipitation in April–June and increased moisture in May–July lead to a shift in the mean date of family group sightings to later in the year, in other words, delaying hatching.
It is assumed that cold weather in spring and early summer can result in clutch replacement, delays to the entire breeding cycle, or later onset of breeding in more favorable conditions. The data obtained are consistent with general trends in the response of birds to an increase in temperature at the beginning of the breeding cycle. It is now well known that as a result of climate change, most birds in the northern temperate zone start laying eggs earlier in warm springs than in cold ones (Crick, Sparks, 1999; Both et al., 2004; Sokolov, 2006; review by Carey, 2009; review by Dunn, Winkler, 2010). Grey partridges demonstrate sensitivity to extreme weather conditions during egg laying. In warm years, the rate of egg laying per day in Grey partridges increases (Potts, 1980). One explanation for possible delays in the partridge breeding cycle may be that low temperatures in the spring slow the growth of grasses, resulting in poor masking of clutches and a high proportion of their destruction by predators (Meriggi et al. 1990).
Similarly, rains in mid-spring and early summer can be a barrier to breeding phases, cause females to abandon clutches, or lead to the death of newly hatched chicks, which in turn may also delay the emergence of broods in the study area. For instance, in France, heavy summer rain sometimes led to abandonment of clutches by female Grey partridges, but only in certain cases (Bro et al., 2014). In the northeastern United States, more rain was usually associated with the later emergence of young birds and delayed breeding readiness in female passerines (McDermott, 2016).
As this study has shown, average air temperature can have other effects. There are some trends in the temporal expansion of family group sightings in the period June – November in the warmest years. Early warmth in mid-spring and early summer contributes to the emergence of broods in early June, while warm November and December months allow an increasing number of family groups to linger in the protected area, and obviously in this area generally, until the end of the year. The number of family group sightings was significantly higher in the spring and autumn in warmer years. At the same time, when considering the linear dependence of temperature and the temporal range of sightings, it can be seen that, as in the case of the correlation coefficient, linear dependence decreases sharply from autumn to winter and even more strongly by the end of the cycle.
The present study also found small positive linear dependence of the mean and median dates of sightings on time that increases when considering the following time segments: June–November (end of autumn), June–December (year end), June–April (through the end of the cycle). In other words, during the study period, the mean and median dates of Grey partridge family group sightings increasingly shift towards the end of the calendar year.
The lack of sustained snowpack at above zero temperatures in October, November, and December appears to improve feeding conditions in the study area. Further, when favorable conditions are ongoing, a non-significant number of birds remain on the site through the end of March or April. In cold years, the duration of favorable conditions for broods at the site is reduced: the first family groups only begin to appear at the end of June, and in October birds are already departing the site due to increasing cold weather combined with heavy precipitation in the form of snow, formation of stable snowpack, and, apparently, deteriorating food conditions. Such processes most clearly occurred in certain years at the beginning of the study time period.
As for the effect of precipitation on the number of bird sightings in the reserve, a negative relationship between these two parameters was found only in the spring and summer periods. Entirely absent in autumn, the negative relationship begins to increase again only in the winter, while remaining non-significant. In December–March, the number of Grey partridges in Burtinskaya Steppe is largely determined by precipitation in the form of snow: in snowy winters, birds either completely depart the area or are present in very low numbers (Barbazyuk, Chibilyov, 2018). The increasingly lengthy delays and wintering of individual coveys on the site under conditions of sustained warming and, as a result of decreasing average snowpack (Barbazyuk, Chibilyov, 2018) in the study area, may explain another emerging trend: the increasing shift in mean and median sighting dates closer to the end of the year over time. This trend is most clearly seen when considering the full cycle of partridge family group sightings from the moment of their appearance in June to the complete dispersal of broods in April–May in the following year. At the same time, as mentioned above, there is no linear relationship between the mean and median date of sightings and precipitation. It is also obvious that further research in the reserve on the relationship between the temporal range and the mean date of sightings and temperature and precipitation over a longer time series is needed.
Conclusions
In the study area, spring and summer temperatures are steadily increasing, and precipitation and the Selyaninov hydrothermal coefficient are declining over the same period.
Temperature, precipitation, and moisture in mid-spring and early summer significantly impact the mean and median dates of partridge family group sightings in Burtinskaya Steppe later in the year. Increased mean temperatures in late spring and early summer shift the mean and median dates of sightings earlier in the annual cycle through the end of the calendar year, while increased precipitation and moisture in April–June have the opposite effect, shifting the mean and median dates of family group sightings to a later stage.
In the warmest years, the temporal range of family group sightings tends to expand from the moment of their appearance in June to the end of autumn. Temporal expansion occurs due to increasingly earlier sightings in June and increased sightings in November and also December. Warm weather in early summer and in late autumn and early winter can contribute to extended favorable conditions for birds in this area. Early warmth in late spring and early summer encourages the appearance of broods in early June, while warm weather in September–November and December and the absence of stable snowpack as a result of that warming allow increasing numbers of family groups to remain in the protected area and in the area generally until the end of the year.
At the same time, there is no correlation between the temporal range of partridge sightings and precipitation over the time period under study. Increased autumn precipitation did not significantly affect the number of sightings during this period. The negative relationship between the number of sightings and precipitation only begins to increase in December, but remains non-significant. It is only in the spring that rainy April and May months result in a significant decline in the number of partridge sightings in June–July, to some extent affecting the temporal range of sightings overall.
Over the length of this long-term dataset, the tendency to shift the mean date and median date of partridge family group sightings towards the end of the year is apparently also associated with the improvement of favorable conditions, primarily related to foraging. Climate warming, declining precipitation in autumn and winter, and declining total snowpack and snow cover duration increase the availability of the forage base for partridges. However, the study found no direct linear relationship between the mean date of sightings and precipitation at various seasonal timescales. A longer time series and a larger amount of data are required to more confidently confirm linear trends in the relationship between the temporal range and the mean date of sightings with meteorological parameters and time.
References
Aebischer N. J., Ewald J. A. The grey partridge in the UK: population status, research, policy and prospects, Animal Biodiversity and Conservation. 2012. V. 35 (2). P. 353–362. DOI: 10.32800/abc.2012.35.0353
Aebischer N. J., Ewald J. A. The grey partridge in the UK: population status, research, policy and prospects, Animal Biodiversity and Conservation. 2012. Vol. 35 (2). P. 353–362. DOI: 10.32800/abc.2012.35.0353.
Böhning-Gaese K. & Lemoine N. Importance of climate change for ranges, communities and conservation of birds, Advances in Ecological Research. 2004. V. 35. R. 211–236. DOI: 10.1016/S0065-2504(04)35010-5
Böhning-Gaese K. & Lemoine N. Importance of climate change for ranges, communities and conservation of birds, Advances in Ecological Research. 2004. Vol. 35. R. 211–236. DOI: 10.1016/S0065-2504(04)35010-5.
Barbazyuk E. V., Chibilyov A. A. The Impact of Winter Meteorological Parameters on Abundance of the Grey Partridge Perdix perdix in the Southern Ural Steppe, Doklady Biological Sciences. 2018. V. 480. P. 103–106. DOI: 10.1134/S0012496618030080
Barbazyuk E. V., Chibilyov A. A. The Impact of Winter Meteorological Parameters on Abundance of the Grey Partridge Perdix perdix in the Southern Ural Steppe, Doklady Biological Sciences. 2018. Vol. 480. P. 103–106. DOI: 10.1134/S0012496618030080.
Berthold P. Avian migration. A general survey, Oxford, UK: Oxford University Press, 2001. 266 r.
BirdLife International. 2016. Perdix perdix. The IUCN Red List of Threatened Species 2016. URL: https://dx.doi.org/10.2305/IUCN.UK.2016-3.RLTS.T22678911A85929015.en (data obrascheniya 18 yanvarya 2021).
BirdLife International. Perdix perdix. The IUCN Red List of Threatened Species 2016. URL: https://dx.doi.org/10.2305/IUCN.UK.2016-3.RLTS.T22678911A85929015.en (data obrascheniya: 18.01.2021).
Both C., Artemyev A. V., Blaauw B., Cowie R. J., Dekhuijzen A. J., et al. Large-scale geographical variation confirms that climate change causes birds to lay earlier, Proceedings of the Royal Society of London. Series B. 2004. V. 271. R. 1657–1662. DOI: 10.1098/rspb.2004.2770
Both C., Artemyev A. V., Blaauw B., Cowie R. J., Dekhuijzen A. J., et al. Large-scale geographical variation confirms that climate change causes birds to lay earlier, Proceedings of the Royal Society of London. Series B. 2004. Vol. 271. R. 1657–1662. DOI: 10.1098/rspb.2004.2770.
Bro E., Brillard J., Millot F. Impact of heavy rains and wet cold weather on Grey partridge Perdix perdix clutch desertion and breeding success, Alauda. 2014. V. 82 (1). P. 51–62.
Bro E., Brillard J., Millot F. Impact of heavy rains and wet cold weather on Grey partridge Perdix perdix clutch desertion and breeding success, Alauda. 2014. Vol. 82 (1). P. 51–62.
Carey C. The impacts of climate change on the annual cycles of birds, Philosophical Transactions of the Royal Society B. 2009. V. 364. R. 3321–3330. DOI:10.1098/rstb.2009.0182
Carey C. The impacts of climate change on the annual cycles of birds, Philosophical Transactions of the Royal Society B. 2009. Vol. 364. R. 3321–3330. DOI: 10.1098/rstb.2009.0182.
Cherenkova E. A. Zolotokrylin A. N. On the comparability of some quantitative indicators of drought, Fundamental'naya i prikladnaya klimatologiya. 2016. T. 2. P. 79–94. DOI: 10.21513/2410-8758-2016-2-79-94.
Cherenkova E.A. Zolotokrylin A.N. in Russian
Chibilev A. A. Orenburgsky reserve: history and natural diversityEkaterinburg: UIPC, 2014. 140 p.
Chibilyov A.A. in Russian
Cotton P. A. Avian migration phenology and global climate change, Proceedings of the National Academy of Sciences of the United States of America. 2003. V. 100 (21). R. 12 219–12 222. DOI: 10.1073/pnas.1930548100
Cotton P. A. Avian migration phenology and global climate change, Proceedings of the National Academy of Sciences of the United States of America. 2003. Vol. 100 (21). R. 12 219–12 222. DOI: 10.1073/pnas.1930548100.
Crick H. Q. P., Sparks T. H. Climate change related to egg-laying trends, Nature. 1999. V. 399. P. 423. DOI:10.1038/20839
Crick H. Q. P., Sparks T. H. Climate change related to egg-laying trends, Nature. 1999. Vol. 399. P. 423. DOI: 10.1038/20839.
DOI:10.1111/j.1365-2486.2007.01404.x
Dunn P., Winkler D. W. Effects of climate change on timing of breeding and reproductive success in birds, Møller A. P., Fiedler W., Berthold P (eds). Effects of climate change on birds, Oxford, UK: Oxford University Press, 2010. R. 113–128.
Dunn P., Winkler D. W. Effects of climate change on timing of breeding and reproductive success in birds, Møller A. P., Fiedler W., Berthold P (eds.). Effects of climate change on birds, Oxford, UK: Oxford University Press, 2010. R. 113–128.
Faragó S., Dittrich G., Horváth-Hangya K., Winkler D. Twenty years of the grey partridge population in the LAJTA Project (Western Hungary), Animal Biodiversity and Conservation. 2012. Vol. 35 (2). P. 311–319. DOI: 10.32800/abc.2012.35.0311.
Faragó S., Dittrich G., Horváth–Hangya K., Winkler D. Twenty years of the grey partridge population in the LAJTA Project (Western Hungary), Animal Biodiversity and Conservation. 2012. V. 35 (2). P. 311–319. DOI: 10.32800/abc.2012.35.0311
Gaiduk V.E. Abramova I.V. in Russian
Gates J. M. Gray partridge ecology in southeast-central Wisconsin. Madison: Wisconsin Department of Natural Resources. Technical Bulletin 70, 1973. 8 p.
Gayduk V. E. Abramova I. V. Ecology of birds in the south-western Belorussia. Non-PasseriformesBrest: BrGU, 2009. 300 p.
Gringof I. G. Pavlova V. N. Funfamentals of agricultural meteorologyObninsk: FGBU VNIIGMI-MCD, 2013. 384 p.
Gringof I.G. Pavlova V.N. in Russian
Gruychev G. V., Angelov E. E. Density of Grey Partridge (Perdix perdix Linnaeus, 1785) population in Sakar Mountain (SE Bulgaria) and the effect of weather and habitats, Ecologia Balkanica. 2019. V. 11 (1). P. 51–62.
Gruychev G. V., Angelov E. E. Density of Grey Partridge (Perdix perdix Linnaeus, 1785) population in Sakar Mountain (SE Bulgaria) and the effect of weather and habitats, Ecologia Balkanica. 2019. Vol. 11 (1). P. 51–62.
Halupka L, Halupka K. The effect of climate change on the duration of avian breeding seasons: a meta-analysis, Proceedings of the Royal Society B. 2017. V. 284. P. 20171710. DOI: dx.doi.org/10.1098/rspb.2017.1710
Halupka L, Halupka K. The effect of climate change on the duration of avian breeding seasons: a meta-analysis, Proceedings of the Royal Society B. 2017. Vol. 284. P. 2017–1710. DOI: dx.doi.org/10.1098/rspb.2017.1710.
Johnsgard P. A. The North American Quails, Partridges, and Pheasants. Lincoln: Zea E-Books. 58, 2017. 131 p. DOI: 10.13014/K2G15Z1P
Johnsgard P. A. The North American Quails, Partridges, and Pheasants. Lincoln: Zea E-Books. 58, 2017. 131 p. DOI: 10.13014/K2G15Z1P.
Kuijper D. P. J. , Oosterveld E., Wymenga E. Decline and potential recovery of the European grey partridge (Perdix perdix) population – a review, European Journal of Wildlife Research. 2009. V. 55. P. 455–463. DOI: 10.1007/s10344-009-0311-2
Kuijper D. P. J., Oosterveld E., Wymenga E. Decline and potential recovery of the European grey partridge (Perdix perdix) population – a review, European Journal of Wildlife Research. 2009. Vol. 55. P. 455–463. DOI: 10.1007/s10344-009-0311-2.
McCrow V. P. Gray partridge habitat use and nesting biology in north-central Iowa: Retrospective Theses and Dissertations. 7516. Ames: Iowa State University, 1982. 239 p. DOI: 10.31274/rtd-180813-5931
McCrow V. P. Gray partridge habitat use and nesting biology in north-central Iowa: Retrospective Theses and Dissertations. 7516. Ames: Iowa State University, 1982. 239 p. DOI: 10.31274/rtd-180813-5931.
McDermott M. E., DeGroote L. W. Long-term climate impacts on breeding bird phenology in Pennsylvania, USA, Global Change Biology. 2016. V. 22. P. 3304–3319. DOI: 10.1111/gcb.13363
McDermott M. E., DeGroote L. W. Long-term climate impacts on breeding bird phenology in Pennsylvania, USA, Global Change Biology. 2016. Vol. 22. P. 3304–3319. DOI: 10.1111/gcb.13363.
Meriggi A., Montagna D., Zacchetti D., Matteucci C., Toso S. Population dynamics of the gray partridge in relation to agriculture and weather in northern Italy, Church K. E., Warner R. E., Brady S. J. (eds.). Perdix V: gray partridge and ring-necked pheasant workshop. Kansas Dept. of Wildlife and Parks, Emporia, 1990. R. 241–256.
Montagna D., Meriggi A. Population dynamics of grey partridge (Perdix perdix) in northern Italy, Italian Journal of Zoology. 1991. V. 58 (2). P. 151–155. DOI: 10.1080/11250009109355746
Montagna D., Meriggi A. Population dynamics of grey partridge (Perdix perdix) in northern Italy, Italian Journal of Zoology. 1991. Vol. 58 (2). P. 151–155. DOI: 10.1080/11250009109355746.
Panek M. The effect of environmental factors on survival of grey partridge (Perdix perdix) chicks in Poland during 1987–89, Journal of Applied Ecology. 1992. V. 29 (3). P. 745–750. DOI: 10.2307/2404484
Panek M. The effect of environmental factors on survival of grey partridge (Perdix perdix) chicks in Poland during 1987–89, Journal of Applied Ecology. 1992. Vol. 29 (3). P. 745–750. DOI: 10.2307/2404484.
Parmesan C. Influences of species, latitudes and methodologies on estimates of phenological response to global warming, Global Change Biology. 2007. V. 13. P. 1860–1872.
Parmesan C. Influences of species, latitudes and methodologies on estimates of phenological response to global warming, Global Change Biology. 2007. Vol. 13. P. 1860–1872. DOI: 10.1111/j.1365-2486.2007.01404.x.
Potapov R. L. The Grey Partridge, Pticy SSSR. Kuroobraznye, zhuravleobraznye. L.: Nauka, 1987. P. 24–39.
Potapov R.L. SR. in Russian
Potts G. R. Partridges – countryside barometer. London: The new naturalist library. Collins, 2012. 465 p.
Potts G. R. Recent changes in the farmland fauna with special reference to the decline of the Grey Partridge, Bird Study. 1970. V. 17 (2). P. 145–166. DOI: 10.1080/00063657009476266
Potts G. R. Recent changes in the farmland fauna with special reference to the decline of the Grey Partridge, Bird Study. 1970. Vol. 17 (2). P. 145–166. DOI: 10.1080/00063657009476266.
Potts G. R. The effects of modern agriculture, nest predation and game management on the population ecology of partridges (Perdix perdix and Alectoris rufa), Advances in Ecological Research. 1980. V. 11. P. 1–79. DOI: 10.1016/S0065-2504(08)60266-4
Potts G. R. The effects of modern agriculture, nest predation and game management on the population ecology of partridges (Perdix perdix and Alectoris rufa), Advances in Ecological Research. 1980. Vol. 11. P. 1–79. DOI: 10.1016/S0065-2504(08)60266-4.
Potts G. R., Aebischer N. J. Population dynamics of the grey partridge Perdix perdix 1793–1993: monitoring, modelling and management, Ibis. 1995. V. 137. P. 29–37. DOI: 10.1111/j.1474-919X.1995.tb08454.x
Potts G. R., Aebischer N. J. Population dynamics of the grey partridge Perdix perdix 1793–1993: monitoring, modelling and management, Ibis. 1995. Vol. 137. P. 29–37. DOI: 10.1111/j.1474-919X.1995.tb08454.x.
References
Sokolov L. V. Influence of global warming on the timing of migration and nesting of passerins in the twentieth century, Zoologicheskiy zhurnal. 2006. T. 85, No. 3. P. 317–341.
Sokolov L.V. in Russian
Tryjanowski P., Hartel T., Báldi A., Szymański P., Tobolka M., et al. Can research in Western Europe identify the fate of farmland bird biodiversity in Eastern Europe?, Acta Ornithologica. 2011. V. 46 (1). P. 79–90. DOI: 10.3161/000164511X589857
Tryjanowski P., Hartel T., Báldi A., Szymański P., Tobolka M., et al. Can research in Western Europe identify the fate of farmland bird biodiversity in Eastern Europe?, Acta Ornithologica. 2011. Vol. 46 (1). P. 79–90. DOI: 10.3161/000164511X589857.
Acknowledgements
The author is grateful to Jennifer Castner from Michigan, USA (Director, The Altai Project) for improving the English version of the manuscript. This report is prepared as part of Institute for Steppe Research Theme # GR АААА-А21-121011190016-1.

 © 2011 - 2026