

Introduction
The most wide-spread approach to the assessment of the absolute number of animals’ populations is based on the capture-mark-recapture method (MRR- method). By now a lot of modifications of MRR-experiment for different taxonomic and ecological objects groups have been described and a lot of recommendations for the use of mathematical models to approximate the results are developed. The most popular recommendation in Russian is that of G.Coli (1979), in English – the monograph of Ch.Krebs (Krebs, 1999), T.Southwood and P.Henderson (Southwood, Henderson, 2000). The common principle of all the proposed algorithms is to use the fraction of marked individuals in order to determine the number of individuals that were never captured. The critical request to the sampling is the randomness of the capture of any individual.
The populations of butterflies are usually studied by means of the Jolly-Seber method using stochastic model as a mathematical basis. It is probably the most informative approach that enables to assess a number of hidden demographic variables, in particular the absolute number, the number for each date of study, population growth etc. on the series of many-fold recaptures. Along with that, this method has a number of features that reduces its effectiveness. The application practice shows that used model is sensitive to small samplings, periodicity and proportionality of captures (Gorbach, 2013). In the first case, it sometimes impossible to carry out calculations because of omitting recaptures of marked individuals in small populations. Another difficulty is due to the unfavorable weather conditions for the flying of butterflies, it sometimes increases the time between the planned dates of marking or forces to finish the regular stage ahead of time, not capturing enough number of individuals. In the case of such failures in the experiment it is possible to assess the absolute number according to one of the -known laws of frequency distribution. In this case the correct strategy is not to use some model for calculations without thinking, taking on faith the underlying hypothesis, but to choose the most suitable model variant for the experimental data.
The purpose of the work is to compare the estimates of the absolute number and to generalize the experience in the use of discrete distributions in order to describe the frequency of captures of individuals in the experiments with fritillary butterflies of genus Boloria. As a theoretical platform we chose two models: Poisson distribution and geometrical one, the latter describes the results in the case of butterflies best of all.
Materials
The studied objects were two species of fritillary butterflies of genus Boloria – B.freija (Thunberg, 1791) and B.aquilonaris (Stichel, 1908). These are typical glacial relicts of the forest zone inhabiting sphagnus bogs of Karelia. Since the bogs are the habits of an island type, the populations of studied species break up into spatially separated groups dedicated to specific areas. The investigation was carried out in the reserve “Kivach” on the adjacent swamps Blizkoye and Osokovoye. Earlier they were considered as a single area (Gorbach, 1998). The data for the analysis were chosen taking into account the differentiation of the objects according to their number: B.aquilonaris is a usual bog species, while B.freija is one of a small species. The same is about the seasons: 1995 was the most successful for B.aquilonaris for last decades, while the number of B.freija was so low that it was no sense to begin the experiment. In 1996 it reduced to its local minimum, but in 2016 it became usual for this species. The total size of samples is 3889 marked butterflies (Tables 1 and 2).
Table1. Distribution of the capture frequencies of Freija fritillary and the estimates of the absolute number of the butterflies in the study area
| k | 1996 | 2016 | |||||
| males | females | imago | males | females | imago | ||
| 1 | 61 | 42 | 103 | 19 | 18 | 37 | |
| 2 | 37 | 29 | 66 | 17 | 11 | 28 | |
| 3 | 10 | 3 | 13 | 7 | 3 | 10 | |
| 4 | 1 | 1 | 1 | 1 | 2 | ||
| 5 | 1 | 1 | |||||
| Poisson distribution | |||||||
| Np,.ind. | 178 | 131 | 307 | 60 | 51 | 110 | |
| lim,.ind. | 159÷206 | 114÷157 | 276÷338 | 54÷70 | 43÷69 | 100÷125 | |
| χ2 | 2.638 | 7.123 | 8.445 | 1.424 | 0.244 | 1.081 | |
| p | 0.450 | 0.028 | 0.037 | 0.840 | 0.970 | 0.897 | |
| Geometric distribution | |||||||
| Ng, ind. | 305 | 228 | 524 | 97 | 86 | 182 | |
| lim, ind. | 266÷365 | 194÷282 | 469÷599 | 84÷118 | 69÷121 | 159÷214 | |
| χ2 | 10.197 | 14.307 | 23.625 | 6.125 | 1.975 | 7.477 | |
| p | 0.017 | <0.001 | <0.001 | 0.190 | 0.578 | 0.113 | |
| Stochastic model of Jolly-Seber of abundance dynamics | |||||||
| Njs, ind. | 216 | 114 | 314 | 119 | 102 | 198 | |
| SE, ind. | 121 | 61 | 141 | 64 | 81 | 93 | |
Note. k is frequency classes of the empirical distribution (number of captures of an individual); Ng, Np, Njs - absolute numbers by Poison, geometric and Jolly – Seber models, accordingly; lim – confidence interval; SE – standard error; χ2 and p – assessment and significance of differences between empirical and theoretical distributions (Pearson's test), significant differences (p<∝ = 0.05) are indicated in bold.
Table2. Distribution of the capture frequencies of B. aquilonaris and the estimates of the absolute number of the butterflies in the study area
| k | 1995 | 1996 | |||||
| males | females | imago | males | females | imago | ||
| 1 | 941 | 985 | 1926 | 690 | 514 | 1237 | |
| 2 | 109 | 132 | 241 | 106 | 82 | 188 | |
| 3 | 12 | 9 | 21 | 8 | 5 | 13 | |
| 4 | 2 | 2 | |||||
| Poisson distribution | |||||||
| Np, ind. | 4963 | 4847 | 9789 | 3198 | 2374 | 5813 | |
| lim, ind. | 4340÷5847 | 4285÷5622 | 8919÷10892 | 2795÷3747 | 2054÷2849 | 5239÷6538 | |
| χ2 | 0.723 | 2.342 | 0.328 | 0.898 | 1.653 | 2.146 | |
| p | 0.697 | 0.504 | 0.954 | 0.638 | 0.199 | 0.342 | |
| Geometric distribution | |||||||
| Ng, ind. | 9534 | 9277 | 18778 | 6096 | 4521 | 11094 | |
| lim, ind. | 8285÷11305 | 8152÷10832 | 17031÷20990 | 5278÷7196 | 3879÷5474 | 9942÷12548 | |
| χ2 | 0.256 | 3.315 | 2.784 | 4.765 | 5.409 | 9.418 | |
| p | 0.880 | 0.346 | 0.426 | 0.092 | 0.067 | 0.009 | |
| Stochastic model of Jolly-Seber of abundance dynamics | |||||||
| Njs, ind. | 3762 | 3420 | 7203 | 2041 | 1590 | 3761 | |
| SE, ind. | 1643 | 1344 | 2106 | 1028 | 783 | 1442 | |
Note. See symbols in Table 1.
Methods
The methodology of sampling has been described in detail earlier (Gorbach, 2013), it is standard for the Jolly-Seber approach and completely meets the requirement of MRR-experiment. The general task in the assessment of the absolute number consisted in that knowing the frequency of re-captures of marked individuals (k = 1, 2, 3, 4, …),to find the frequency of the zero class (k = 0), i.e. to determine the number of individuals, which were not captured during the experiment. The size of this class and, consequently, the value of desired variable (sum of all frequencies) depend on the pattern of the distribution.
The Poisson distribution assumes the constant probability of the captures of individuals, which is possible only in “closed” population with very small, ideally – zero death rate in the course of the experiment. The frequency distribution is the approximation of binomial distribution for the cases when а p<<q (Korosov, 2007), where p is a probability of finding the object of necessary quality, in our case – that of catching marked individual, q is a probability of not finding this object, 0 < p ≤ 1 and q = 1 − p. At that a random variable takes the whole-number value with the probability Pk = e−λ·λk/k!, where λ is a parameter of distribution, k! – a factorial of k, e - the base of the natural logarithms. The absolute number is calculated by the formula Np = s/µ, where s is the total number of captures, µ - the arithmetic mean of the distribution with zero class, which is given by the equation M = µ/(1 − e−µ). Finding the values of the variable µ makes a certain difficulty, since the given equation has a direct solution only in the cases, when the arithmetic mean of the truncated (empirical) distribution M > 2. In this case the Lagrange interpolation polynomials are used, in other cases the desired value is chosen by try-and-error method (Coli,1979). It is easier to solve this problem by the optimization appliances embedded into computer programs, for example, by means of the package “Search solution” in MS Excel or the function “optimize” in R environment.
Geometric distribution is used to describe the processes in which the probability of some events is not constant (Coli, 1979). It is considered that this model will be adequate to experimental data when individuals have various predispositions to fall into the trap. The geometrical distribution is the limiting case of negative binomial distribution with the probability function Pk = p·qk. The absolute number is calculated as Ng = n·(s − n)/(s − 1), where n is the number of marked individuals.
The errors in estimates were determined by simple non-parametric bootstrapping with the number of iterations B = 5000 (Shitikov, 2012; Shitikov, Rosenberg, 2013). Having constructed the ordered sample of bootstrapped values of the mean value, the boundaries of the confidence interval were found by the method of percentiles (Fig.1). The limits of variability Np and Ng were assessed by these extremes, taking into consideration s = n·Mlim , where Mlim is minimal or maximal value of bootstrapped mean value. The adequacy of models to initial data was determined by Pearson criterion (χ2), comparing empiric frequencies with theoretical distributions. The frequencies of corresponding theoretical distributions (Ak) were calculated by the common formula Аk = N·Pk, where N is the absolute number. The contribution of differences of zero classes into the criterion value was taken equal zero, allowing that the number of uncaught individuals a0 correspond to the calculated value A0. The parameters of distributions were determined as λ = M, p = 1−(s − n)/(s − 1). The calculation algorithms in the language R was used (see script). The number of frequency classes of the theoretical distribution was set to the number of classes of empirical sample, and the remains of their “tails” merged with the frequency Ak of the last class. In calculating the number of degrees of freedom the presence of zero classes was taken into consideration. The assessment of the absolute number by the Jolly-Seber method was carried out in accordance with the technique published earlier (Gorbach, 2013), the procedure of optimization by the model parameters fitting to the biologically reasonable data was also realized.
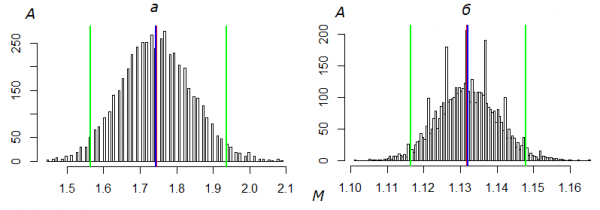
Fig.1. Distribution of the arithmetic average (M) of capture numbers obtained by the bootstrap- method for all Freija fritillaries in 2016 (а) and all Cranberry fritillaries in 1995 (б). A is the number of samples (ΣA = B = 5000), the red line indicates the M value of the original sample, the blue line is the M value corrected by bootstrapping, the green lines are the confidence interval Mmin÷Mmax
Results
The results of the absolute number estimation and the consequent analysis of the distributions of butterflies captures frequencies in MRR-experiment allowed to come to the following conclusions: 1) geometrical model gives the highest values of the population number, they are 1.5 – 2 times higher than the Poisson evaluation; 2) the values obtained by the Poisson method better correspond to model estimates of Jolly-Seber; 3) Poisson distribution is more adequate to experimental data. However, there are some deviations from the general trends. Thus, the absolute number estimation carried out by the method of Jolly-Seber in the samples of 2016 is more similar to the geometrical estimation (see Tabl.1); the captures of males of B. aquilonaris in 1995 are approximated by the geometrical model better than by Poisson distribution.
The general regularity in the distribution of empirical frequencies consists in the lack of individuals captured once and excess of the individuals captured twice comparing with the theoretical proposals (Fig.2). The limiting variant was observed in females B.freija in 1996: the noticed disproportion resulted in significant discrepancy with theoretical frequencies and significantly affected the distribution of generalized frequencies for all the individuals in this season. Only in males B. aquilonaris mentioned above the empirical frequencies a1 = 941, a2 = 109 и a3 = 12 were able to get to the frequency interval Ap÷Ag: 931÷944, 113÷105 and 10÷13.
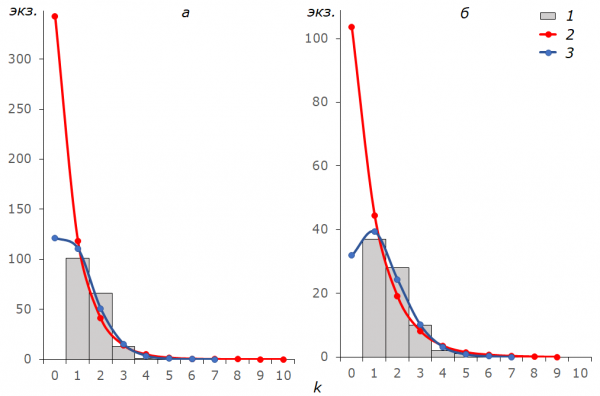
Fig.2. Frequencies of captures of all imago samples of Freija fritillaries in 1996 (а) and 2016 (б). k – the capture number of the specimens (classes of frequencies), 1 – empirical frequencies a, 2 – frequencies of the geometric distribution Ag, 3 – the Poisson distribution frequencies Ap
Discussion
The stochastic model of Jolli-Seber of the population dynamics suggests quite high level of elimination of studied butterflies groups due to death and emigration of individuals (Gorbach, 2013). Hence, the requirement of equal probability of captures is violated; it means that the estimates of the absolute number calculated by Poisson method cannot be quite adequate, and the geometrical model conceding not constant probability must describe better the obtained samples. Meanwhile, the results of the comparison of distributions are inconsistent with this assumption. The similarity of the estimates by Jolly-Seber model providing for the unstable course of demographic processes and Poisson model testify about a quite good descriptive potential of the latter, indicating to its quite acceptable tolerance to the violations of equal probability of captures during the experiment. Giving preference to Poisson estimates, it should be stressed that here we are talking about spatially isolated groups with naturally limited incoming and outgoing flows of individuals. The accordance of frequencies to Poisson distribution among other things can serve as some sort of indicator of “closeness” of similar population systems.
The estimates based on the geometrical model should be treated with caution as unreasonably high, particularly in the case of large samples. When a population increases, the probability of re-captures reduces: the less the average value, the more the growth of the zero class and the higher the estimated number. For example, judging by the number of B. aquilonaris (see Table 2), we received that in 1995 the average density of the swarms had to be about 500 imago for a season on the accounting platform 50 x 50 m (Gorbach, 2011), but the total number of caught individuals in these platforms was significantly less: it was not more than 300 with the average estimate 50 individuals. The drift of empirical frequencies toward the geometrical distribution can be treated as a display of different demographic perturbations, particularly the increase in migration flows. However, in the mentioned case with the males B. aquilonaris the reason was another: it was connected with the conditions of sampling. The matter is that the unusual behavior of this species allowed us to continue the experiment when the weather worsened, when the butterflies stopped flying. They stayed on cowberry inflorescens, therefore it was able to collect, mark and return individuals getting around the clusters of this plant. At that the fraction of males significantly reduced, because many of them unlike females hided in the lower vegetation layer and became inaccessible. In the season of 1995 there were more than a half of the days with unstable or cloudy weather, therefore the noticed regularity affected the general sample, and the compliance with the distribution should be considered as a consequence of unstable probability of the males captures in various conditions.
The answer to the question why the values of the absolute number of B. freija in 2016 calculated by the Jolly-Seber method strongly deviate from Poisson estimates, consists in the unstable stochastic model applied to the small samples. The participation of random events in the formation of variants increases essentially, worsening imbalances in the distribution of the capture number. As a result, the model parameters used to calculate the variables take the values impossible from the biological point of view. The inconsistency them with reality gave the obviously low final estimates to the point that the calculated absolute number was less than the number of marked individuals. Introduction to the model biologically reasonable constraints made these parameters more adequate, but the values of the numbers are unreasonably high. It is possible to understand the fairness of this conclusion by comparing the samples of B. freija females equal in size obtained in 1996 and all the imago in 2016 (see Table1). In the second case the Jolly-Seber method gave the value of the absolute number 1.7 times higher. If we compare the generalized samples of this species, and in both seasons it was possible to catch almost all the butterflies seen, it is clear that in 2016 the abundance was at least twice lower than in 1996. Hence, it remains to state that just here the Poisson model more realistically reflects what we observe.
The marked disproportion between the frequencies of captures in samples and their predicted probabilities (see Fig.2) says for “closeness” of the studied groups. The reduction of the number of meeting unmarked individuals against the background of recaptures growth is usually observed when the population structure is quite stable, and the individuals stay in the same patches where they were marked, and the increase due to the hatching of new butterflies from pupae and immigration are inappreciable. To illustrate this, the sample of B. freija can be used. In the season of 1996 the population density of this fritillary was quite high, but, nevertheless, it was possible to catch all the met butterflies. As a result, the number of individuals caught for the first time decreased with each visit to the habitat, but the occurrence of marked individuals increased. In females, sedentary behavior was more pronounced, as they, in comparison with males, are not so active at first and begin to disperse, having only laid a considerable part of eggs in a place of their hatching. When the population grows as in the case of B. aquilonaris the possibility of catching every butterfly seen falls, and, due to the fact that many of them go unnoticed, the effect of settlement on the frequency of catches is minimized. When the sample size decreases similar to B. freija in 2016, the law of large numbers becomes inoperative, and the distribution of frequencies seem to strongly depend on every random encounter.
Conclusions
The frequency of butterfly catching in the MR experiment in the study of spatially separated groupings is best described by the Poisson distribution. The estimates of the absolute number calculated on the basis of this model are the most adequate: as a whole they are in good agreement with the values obtained by the Jolly-Seber method. In the case of small samples the approximation of experimental data by the Poisson distribution seems to remain the only possible way to receive the adequate estimates of the population number. The shift of the empirical frequency toward the geometric distribution can be an indicator of the dynamics of demographic processes: the growth of elimination undoubtedly decreases the proportion of recaptures, and the active replenishment of a population result in the increase of the proportion of firstly captured individuals. When considering the correspondence to the Poisson distribution as a measure of grouping isolation it should be understood that the local settlement of individuals can change the pattern of the empirical distribution, increasing the recapture frequency, so that the differences from the theoretical distribution become significant. In this case the discrepancy with the Poisson model will be the argument in favor of the “closeness” of the studied population system.
References
Gorbach V. V. Seasonal dynamics and sex ration in a population of the butterfly Boloria aquilonaris (Lepidortera, Nymphalidae), Zoologicheskiy zhurnal. 1998. T. 77. No. 5. P. 576–581.
Gorbach V. V. Spatial distribution and mobility of butterflies in a population of the Cranberry Fritillary Boloria aquilonaris (Lepidoptera, Nymphalidae), Ekologiya. 2011. No. 4. P. 289–296. doi: 10.1134/S1067413611040060.
Gorbach V. V. The study of population dynamics by the Jolly – Seber method in the butterflies (Insecta, Lepidoptera: Hesprioidea et Papilionoidea), Principy ekologii. 2013. T. 2. No. 2. P. 14–28. doi: 10.15393/j1.art.2013.2601.
Koli G. Analysis of vertebrate populations. M.: Mir, 1979. 362 p.
Korosov A. V. Special methods of biometry. Petrozavodsk: Izd-vo PetrGU, 2007. 364 p.
Krebs C. J. Ecological Methodology. Menlo Park: Addison-Wesley, 1999. 620 p. URL: http://www.zoology.ubc.ca/~krebs/books.html (data obrascheniya 31.03.2018).
Shitikov V. K. Rozenberg G. S. Randomization and bootstrap: statistical analysis in biology and ecology using R. Tol'yatti: Kassandra, 2013. 314 p. URL: http://www.ievbras.ru/ecostat/Kiril/Article/A32/Stare.htm (data obrascheniya: 21.03.2018).
Shitikov V. K. Use of randomization and bootstrap in processing the result of ecological observations, Principy ekologii. 2012. No. 1. P. 4–24. doi: 10.15393/j1.art.2012.481.
Southwood T. R. E., Henderson P. A. Ecological methods. Oxford: Wiley-Blackwell, 2000. 592 p.

 © 2011 - 2026