

Introduction
The paleontological record provides extensive information on past mammalian diversity and species richness. These data are of particular importance for understanding the historical patterns of terrestrial ecosystems formation in the late Pleistocene-middle Holocene (MIS 3 – MIS 1: ≈ 50-5 thousand years ago) during the period of sharp changes in the global climate on the Earth, but still without extensive impact of human economic activity. This information is the basis of the hypotheses about the impact of similar climate changes on biota in the future.
The history of the European mammalian fauna in the late Pleistocene – Holocene of Europe is quite fully documented based on the analysis of hundreds and thousands of locations (Smirnov et al., 1990; Маркова et al., 2008; Danukalova et al., 2018; Bachura, Kosintsev, 2007; Ponomarev et al., 2012; Puzachenko, Markova, 2014; Álvarez-Lao and Méndez, 2016; Pavelková-Řičánková et al., 2015; Crees et al., 2016; Dinnis et al., 2016; Royer et al., 2016; Fernández-García et al., 2016; Kosintsev et al., 2016; Discamps and Royer, 2017; and many other).
One of the key climatic events of the considered time interval was the transition between the last glaciation of the late Pleistocene and the interglacial of Holocene. The formal stratigraphic boundary between the Pleistocene and Holocene is accepted according to (Walker et al., 2009) and is in the region of 11,700 thousand years with a maximum error of 99 years. However, before and after this conventional boundary, the fauna underwent various transformations.
Our studies of the composition of the regional fauna of large and medium-sized mammals in Eastern Europe (Puzachenko and Markova, 2014; 2016) showed that changes in the species composition at the end of the Late Pleistocene were nonlinear and irreversible. The transition between the complexes of large mammals of the Pleistocene and Holocene was very sharp, almost intermittent. Subsequent studies, including the entire mammalian fauna of Europe, dated to an interval ≈ 50–5 thousand years ago, revealed a much more complex and controversal reaction of mammalian complexes to changes in the global climate, including at the level of individual regions (Markova, Puzachenko, 2017; Puzachenko, Markova, 2019).
The amazing phenomenon of “disharmonious”/“non-analogous” geographical associations of mammalian species (Semken, 1988; Semken et al., 2010) of the late Pleistocene not only in Europe was a combination of high species diversity of mammals with high stability of the entire complex against the background of a very severe climate of Valdai (= Vistula, Wurmian) glaciation. In addition to low temperatures and aridity, the climate of the last glaciation was characterized by high variability of the climatic situation, which is not typical for the climate of the modern interglacial period (Svendsen et al., 2004). "Disharmony" of faunas is estimated in relation to modern faunal complexes. Many species that were a part of the Eurasian faunal complexes of the “mammoth steppe” in the Pleistocene, in the Holocene have very different ecological niches, occupy allopatric areas, and do not occur in the same communities. A characteristic feature of the Pleistocene complexes was the presence of large herbivorous and predatory mammals (“mega fauna”). This most important ecosystem component almost completely disappeared at the end of the Pleistocene, and the few herbivorous representatives of the mega fauna that survived the Pleistocene – Holocene boundary (mammoth, bison, European bison, wild ox, giant deer) could not survive the extremely warm climatic optimum of the Middle Holocene or were exterminated by humans already in the middle ages. Transformation of Eurasian ecosystems, including the formation of a continuous forest zone in the last 10 thousand years resulted in the evolution of modern zonal interglacial ecosystems, which in the vast majority of cases do not have analogues in the late Pleistocene. These transformations of the natural environment affected the territory of Europe to the greatest extent.
Understanding the mechanisms of self-development of ecosystems in the past by identifying restrictions (rules) of variations of their most important parameters should be the basis for the creation of modern effective technologies of management (environmental management) and the probabilistic prediction of ecosystem evolution in the future (Puzachenko Yu.., 2017). In this regard, the period of transformation/rearrangement of Late Pleistocene ecosystems is of particular interest. This period was accompanied not only by the well-known extinction of mega fauna, but to a much greater extent by the changes in the areas of species that are currently either absent in Europe or their areas have sharply decreased or, conversely, expanded in Holocene.
Based on extensive paleontological material, we reconstructed the evolution of mammalian faunas of 19 regions of Europe (Puzachenko, Markova, 2019). The results of this work served as the basis for this study. The material allows us to give a fairly accurate estimate of the time interval of the “transition” between two global states of regional faunas at the turn of the Pleistocene and Holocene. In addition, we determined a number of key parameters of the biological diversity of faunal complexes before the transition, during the transformation of faunas and in the first half of the Holocene. The main goal of the study was to find general patterns (invariants) reflecting the process of evolutionary changes in the parameters of biological diversity: species richness, entropy, dominance index (Simpson, 1949), measure of organization or redundancy (Shannon, 1948; Foerster, 1960) - widely used in environmental studies of modern ecosystems. In addition to those listed above, the parameter β of rank distributions and the index of "species turnover" of Wilson and Schmid βt (Mourelle and Ezcurra, 1997) were used as an analogue of the beta-diversity of Wittiker. At that, we proceeded from the working hypothesis that "transition" of faunal mammal complexes from their state in the Pleistocene to the state in the Holocene was a non-equilibrium, irreversible process, accompanied by the loss of "sustainability" in mammalian communities.
Materials
The zoogeographic zoning of Europe accepted in this work (Fig. 1) is based on an analysis of modern ranges of terrestrial mammals presented in the IUCN database (Terrestrial Mammals. IUCN, 2016. The IUCN Red List of Threatened Species. Version, 2016–1. http://www.iucnredlist.org/technical-documents/spatial-data). The principles of zoning using GIS technology are described in (Heikinheimo et al., 2007; Kreft, Jetz, 2010). A detailed technique of our zoning option is given in (Puzachenko, Markova, 2016; Markova, Puzachenko, 2018). The results of studies summarized in (Markova et al., 2008) were the basis for the use of modern zoogeographic zoning for paleoreconstructions. There the relative stability of the position of the main zonal boundaries in Europe at the end of the Late Pleistocene and in the Holocene was shown.
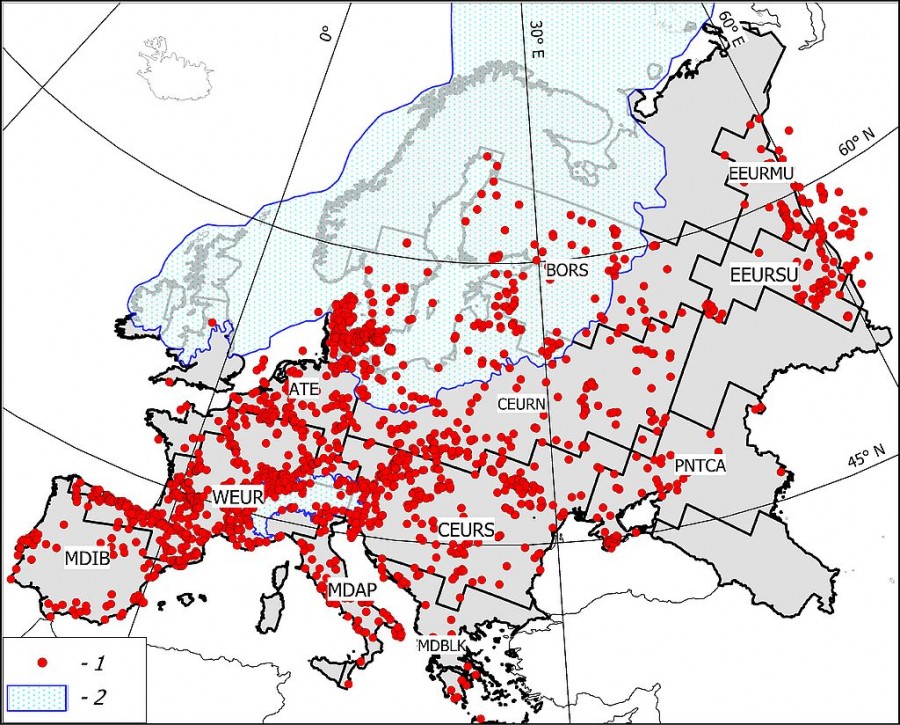
Fig.1. Scheme of 11 regions mentioned in the paper and the paleontological locations dated the second half of the Late Pleistocene – the Middle Holocene. Explanation of the abbreviations of the regions, see table. 1. 1 – Scandinavian ice sheet at the maximum of the Valdai Glaciation (isotopic stage MIS 2), 2 – locations
This paper presents the results of studying the diversity parameters of 11 regional mammalian complexes (Table 1). The information base was taken from the paleontological bibliographic database PALEOFAUNA (Markova et al., 1995), which was collected and maintained by the authors for over the past 25 years (registration number 2011620493, Institute of Geography, Russian Academy of Sciences). In general, the composition of 2593 mammalian locations, mainly dated by the radiocarbon method, was analyzed.
Table 1. Names of the biogeographic regions and their abbreviations, number of locations, and number of species in a paleontological record
| Bioregion | Abbreviation | Number locations |
NSP |
| Atlantic East | ATE | 597 | 109 |
| Boreal South | BORS | 208 | 41 |
| Central European North | CEURN | 385 | 119 |
| Central European South | CEURS | 795 | 134 |
| East European Middle Ural | EEURMU | 134 | 75 |
| East European Southern Ural | EEURSU | 137 | 81 |
| Mediterranean Apennine | MDAP | 304 | 81 |
| Mediterranean Balkan | MDBLK | 109 | 75 |
| Mediterranean Iberian | MDIB | 381 | 92 |
| Ponto-Caspian | PNTCA | 145 | 65 |
| West European | WEUR | 2593 | 143 |
Methods
All radiocarbon (14C) dates were calibrated using the Intcal13 calibration curve in OxCal 4.3 software (Ramsey and Lee, 2013; Reimer et al., 2013). An uneven time scale is used due to the hyperbolic growth of the “error” (standard deviation) of dates depending on the age of the location, (Royer et al., 2016; Puzachenko, Markova, 2019). As a result, for each region, all data on the occurrence of mammalian locations were aggregated over 30 time intervals with the length of the last from 620 years (Late Holocene) to 5.6 thousand years (≈
For each timeline interval, we determined the total number of species and for each species - the frequency of occurrence of the locations, in which it was found. The distribution of relative values was “normalizes” using the arcsine transform (Sokal and Rohlf, 1995). Each interval was characterized by a set of location frequencies of different species ("descriptive variables"). Similarity/difference relations between intervals were set by metric. The Bray-Curtis index (Bray, Curtis, 1957; Ricotta, Podani, 2017) which describes the relationship between all pairs of intervals by the ratio of occurrence of locations with different species of mammals was used as a metric.
Thus, a “system” as an object of modeling is defined as a set of elements (timeline intervals), their descriptive variables and metrics, which defines the relations between all elements. The modeling task is to highlight the ordered relations between the elements of the system against a background of random noise. At that, the initial data for the model are contained in the matrix of values of the Bray-Curtis index. Further, this matrix was processed by the method of non-metric multidimensional scaling (Davison, 1983) in order to coordinate time intervals in Euclidean space of small dimension space (in more detail, see (Puzachenko and Markova, 2014; 2016). According to the condition of obtaining, the model coordinates (denoted by BC1, BC2, and BC3) contain basic information about the ordered (non-stochastic) components of the temporal dynamics of the regional fauna structure. The dimension of the models varied from 2 to 5. The model coordinates are the invariants of the variability of the occurrence of separated types of complexes. They can also be interpreted as order parameters of a “system” in the context of a synergetic model.
It was shown (Puzachenko, Markova, 2019) that BC1 and/or BC2 correlate δ18O (‰) (the median value of the index was calculated for each time interval using the database of the North Greenland Ice Core Project Oxygen Isotope Data, NGRIP (Andersen et al., 2004)) and species richness.
The simulation results are used here only to determine the boundaries of the time interval at which the reorganization of the regional faunal complex took place. For this purpose, graphs were constructed between successive values of model coordinates (Lamerey diagram, but without approximating the data by a polynomial). Since, by condition, the coordinates BC1 and BC2 do not correlate with each other, the “transition” interval for each of them may not coincide or can be expressed only in one of them. In other words, it is assumed that, for some properties of the system, transition boundaries can be expressed, and for other properties that are not dependent on them, no changes can be observed (see, for example (Puzachenko Yu., 2017)).
To characterize the biological diversity of the three assumed states of the regional faunal complexes (“Pleistocene”, transition, “Holocene”), we used: species richness (NSP) – the number of species recorded in the regional fossil record, dominance index, D = ∑i (ni/N)2, 0 ni is the number of locations with the species i, N is the total number of locations, Shannon entropy, H = -∑i (ni/N) ∙ ln (ni/N), the measure of organization or "redundancy" (R = 1-H / lnNSP, where NSP is the number of species.
To compare the taxonomic diversity of different states of faunal complexes, we used a modification of the Wilson – Schmid index of “species turnover” (Mourelle, Ezcurra, 1997): βt = (g + l)/(2α ∙ (n-1), where g is the increase in the number of detected taxa on the “gradient” between successive states, l is the number of “disappeared” taxa on the same “gradient”, α is the average number of taxa for all states, n is the number of simultaneously compared states (0 ≤ βt. ≤ 1).
In modern ecology, models of rank distributions are a traditional tool for studying the structure of communities (Levich, 1978; 1980; 2005; 2007; Bulgakov, Levich, 2005; Puzachenko Yu. 2009; 2013; 2016; Hutchinson, 1957; Margalef, 1957; Tokeshi, 1993; Hubbell, 1997; Marquet, 2000; 2005; Magurran, 2004; McGill et al., 2007 and many others). The most general theoretical justification of rank distributions is given by A.P. Levich as a consequence of applying the extreme principle to systems which implementation is limited by some widely interpreted variables – the “environment resources” (Levich, 1978; Bulgakov, Levich, 2005).
In our study the descending frequency distributions of locations with different taxa for the three states of the faunal complex were compared with three types of model rank distributions. Relatively simple models are associated with the Gibbs hyperbolic distribution (or the Geometrical Motomura model), known from statistical mechanics (further referred to by the abbreviation G): p(r) = exp(λ + β ∙ r), where p(r) is the locations occurrence frequency of species with rank r (the location with the most frequently encountered species has a rank 1), λ and β are the model parameters. The β parameter characterizes the degree of equalization of the distribution. In this model, a linear form of the species sensitivity function to the variation of resources is assumed.
The Zipf (Z) and Zipf-Mandelbrot distributions have the following form: (Z) p(r) = exp(λ + β ∙ ln (r)) and (ZM) p(r) = exp(λ + β ∙ ln (r + d)) (d is an additional parameter proposed by B. Mandelbrot (1954)). The last two distributions characterize systems in which the sensitivity of species to resource variation obeys a logarithmic dependence. The MacArthur broken stick model in which the “species” – “resource” obeys the double logarithmic dependence (~ ln (ln (r))) is very close to the ZM distribution model in its meaning and results.
Within the framework of the problem solved here, the choice between the ZM distribution and the broken stick model based on statistical criteria was difficult in most cases, when both distributions satisfactorily described observations. Therefore, we opted for a simpler ZM model.
Yu.G.Puzachenko (2016) proposed modifications of the considered models, assuming that the duration of a species existence in a community can be proportional (with a different sign) to its rank. We previously examined the corresponding modifications of the G, Z, and ZM distributions and found that the modification of the ZM distribution (ZMst: p (r) = exp (λ + ln (r + d) ∙ (c + β ∙ ln (r + d))) often gave the best approximation result. The ZMst distribution does not correspond to the equilibrium model, but reflects the stationary state of the community, when the “directed” changes in it occur rather slowly, not catastrophically, i.e. the rates of these changes do not differ significantly from 0.
For statistical data processing we used software products STATISTICA v. 8.0 (StatSoft, Tulsa, OK, USA) and PAST v. 3.12 (Hammer et al., 2001).
Results
Time and duration of the reorganization of regional faunal complexes at the turn of the Pleistocene and Holocene
The duration of the time interval during which the transition of mammalian faunal complexes from the state characteristic of the late Pleistocene to the state realized in the first half of the Holocene was determined on the graphs of changes in invariants (model coordinates) BC1 or BC2. For most regional complexes, only the coordinate BC1, which contains basic information about the ordered change in the locations occurrence frequency with different species, showed dynamic features that allowed us to consider the whole process as a sequential change in the “state” of the community in time (Table 2). In most cases, these changes were clearly associated with a parallel change in the climate and the dynamics of species richness.
Table 2. Meantime, start and end time of the transformation (Thousand years ago) in a European regional faunal assemblage' state between the End of the Late Pleistocene and the first part of the Holocene, which reproduced in BC1 and BC2 axes of non-metric multidimensional scaling model; Spearman correlation coefficient with its statistical significance (p) for the climate variable δ18O (‰) or species richness (SPN) and BC1/ BC2 axes
| Регион | BC1 | BC2 | BC1 | BC2 | ||
| δ18O, p | SPN, p | δ18O, p | SPN, p | |||
| ATE | 7.6, 8.7–6.6 | – | 0.53, <0.01 | -0.69, <0.01 | -0.78, <0.01 | не достов. |
| BORS | 13.4, 15.8–11.0 | 13.3, 14.7–11.9 | 0.74, <0.01 | 0.81, <0.01 | 0.45, <0.05 | не достов. |
| CEURN | 12.0, 13.7–10.2 | – | 0.74, <0.01 | -0.81, <0.01 | не достов. | не достов. |
| CEURS | 13.0, 15.8–10.2 | – | 0.88, <0.01 | -0.60, <0.01 | не достов. | 0.55, <0.01 |
| EEURMU | 16.9, 18.0–15.8 | – | 0.81, <0.01 | не достов. | не достов. | 0.62, <0.01 |
| EEURSU | – | 14.8, 15.8–13.7 | не достов. | не достов. | -0.84, <0.01 | 0.55, <0.01 |
| MDAP | – | 8.3, 9.4–7.2 | 0.47, <0.05 | -0.51, <0.01 | -0.65, <0.01 | не достов. |
| MDBLK | 12.3, 12.8–11.9 | 8.0 (?), 8.7–7.4 | 0.85, <0.05 | не достов. | не достов. | не достов. |
| MDIB | 11.1, 11.9–10.2 | - | 0.77, <0.01 | -0.92, <0.01 | -0.44, <0.05 | не достов. |
| PNTCA | 11.9, 12.8–11.0 | - | 0.38, <0.04 | -0.62, <0.05 | не достов. | 0.48, <0.05 |
| WEUR | 11.6, 13.7–9.4 | 3.0, 15.7-10.2 | 0.78, <0.01 | -0.87, <0.01 | -0.86, <0.01 | 0.52, <0.01 |
Three variants of changes in the state of complexes characterizing different regional complexes can be distinguished. The first variant is characterized by a very sharp transition between the two states of the “Pleistocene” and “Holocene” (Fig. 2A, 2B, 2C) relative to the axes of the abscissa and ordinate of the Lamerey diagram, an almost intermittent transition on the time scale. This group includes the regions PNTCA, CEURN, MDBLK, ATE and BORS. The graphs show that the state of faunal complexes in the Pleistocene was relatively stable. The amplitude of fluctuations in BC1 values in the Holocene is higher, which, however, may be an artifact of shortening the step of our time scale.
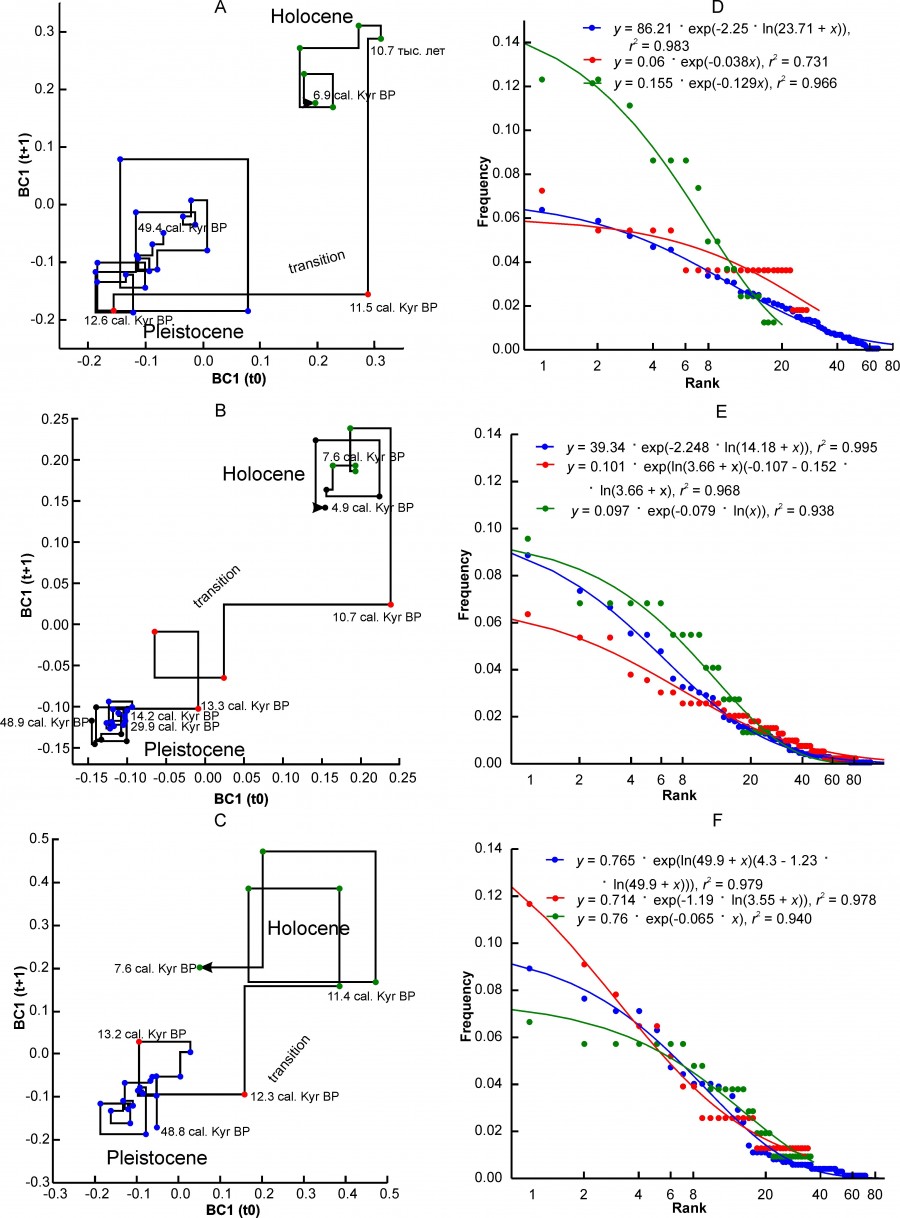
Fig. 2. Lamerey diagram of BC1 coordinate and rank distributions for three states of a regional faunal assemblage. A, D – region PNTCA, B, E – region CEURN, C, F – region MDBLK. The points corresponding to the three states of the assemblage are highlighted in different colors: blue – "Pleistocene", red – "transitional", green – "Holocene". The numbers on the graphs indicate the age in thousand years
During the" transition" there is a loss of stability of the complex, which is well reflected in the charts. In general, this type of graph externally and possibly substantially corresponds to the scheme of phase transition of the first kind. The duration of the instability period varies in different regions from 4.8 thousand years to ~ 1 thousand years (see Table. 2). The transition may have been completed before or after the formal Pleistocene-Holocene boundary (MDBLK). In the ATE region, the restructuring of the complex began with a long delay, in the boreal sub-stage of the Holocene, and was completed only in the middle Holocene (Atlantic sub-stage). Note that the time of completion of the post-Pleistocene transformation of fauna in the Holocene for European ecosystems is very convenient. Since the late Neolithic, human activity has been the driver of evolution, especially of Western European fauna, preventing the achievement of equilibrium at the level of regional complexes.
Another version of the dynamics is characterized by gradual changes in the direction from the Pleistocene state to the Holocene state (Fig. 3A, 3B, 3C). At that, the relatively stable initial and final states of the complex are sometimes difficult to distinguish on the graph. The EERMU region (Fig. 3A) occupies an intermediate position between the regions with the first and second variants of the dynamics of faunal complexes. Besides the EERMU region, the last group includes the regions MDIB, WEUR and CEURS. The duration of the transition varies from 4.3 thousand years (WEUR) to ~ 1.7 thousand years (MDIB). The period of major transformations falls mainly in the interval from 13.7 thousand years to 10.2 thousand years, i.e. from the first Pleistocene interstadial warming of the Belling – Allered to the beginning of the boreal sub-stage of the Holocene. The restructuring of the middle Urals complex (EEURMU) occurred about 2 thousand years earlier, in the Late Glacial period (Table 2).
The mammalian complexes of the Apennine Peninsula (MDAP) and the southern Urals (EEURSU) make up the third group, in which we did not find the signs of restructuring of the complex at the Pleistocene – Holocene boundary in the BC1 coordinate (Figs. 4A, 4B, Table 2). This means that the changes that naturally occurred at that time (extinction, migration, etc.) did not affect significantly the structure parameters. The second coordinate BC2 of models reflects these changes (Table 2) that occurred on the Apennine Peninsula in the first half of the Holocene, and in the Urals much earlier, in the Late Glaciation. Moreover, in both cases, the climate changes were the leading external factor, as evidenced by the correlation of coefficients BC2 with δ18O.
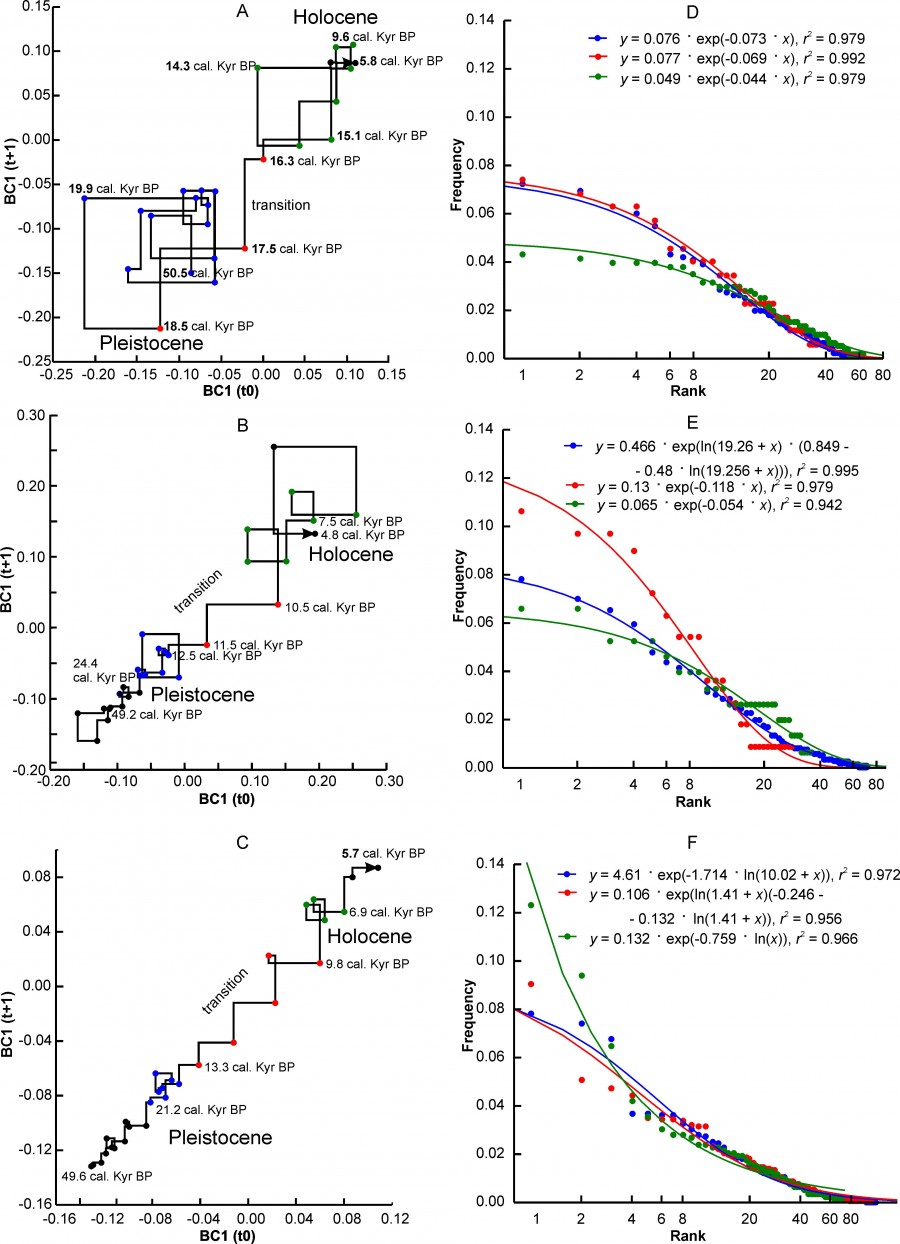
Fig. 3. Lamerey diagram of BC1 coordinate and rank distributions for three states of a regional faunal assemblage. A, D – region EEURMU, B, E – region MDIP, C, F – region WEUR. The points corresponding to the three states of the assemblage are highlighted in different colors: blue – "Pleistocene", red – "transitional", green – "Holocene". The numbers on the graphs indicate the age in thousand years
The data in Table 2 show that global climate changes acted as the main driver of the evolution of the structure of regional faunas. Basically, the climatic factor influenced fluctuations in the species richness of faunas (NSP variable). The BC2 coordinate contains additional independent information on the impact of climate on the occurrence of individual species or the main climate-related trend, as in the case of MDAP and EEURSU regions.

Fig. 4. Lamerey diagram of BC1 coordinate and rank distributions for three states of a regional faunal assemblage. A, C – region MDAP, B, D – region EEURSU. The points corresponding to the three states of the assemblage are highlighted in different colors: blue – "Pleistocene", red – "transitional", green – "Holocene". The numbers on the graphs indicate the age in thousand years
General patterns and variability of parameters of biodiversity of regional faunal mammalian complexes at the turn of Pleistocene and Holocene
The parameters of biological diversity (Table 3) demonstrate significant variability in different regions and for different states of faunal complexes. Against this background, the regularities of their variability common to most complexes are as follows: 1) a relatively sharp decrease in species richness between the state of the complexes before the transition (Pleistocene) and the transitional state (Fig. 5A), which generally correlates with entropy (H) (Fig. 5B), 2); the Holocene state is more characterized by a high dominance index compared to the Pleistocene state (Fig. 5G); 3) there is a clear trend of a decrease in organization (R) from the Pleistocene state to the Holocene state (Fig.5B). Thus, the main changes in the structure of faunal complexes at the Pleistocene – Holocene boundary are reflected in the decrease in species richness/diversity of regional faunas and their organization.
Table 3. Diversity parameters of regional mammalian assemblages: NSP – species richness, H – entropy (nit), D – dominance index, R – redundancy/organization
| Region | Condition of the complex | |||||||||||
| "Pleistocene" | transitional | "Holocene" | ||||||||||
| NSP | H | D | R | NSP | H | D | R | NSP | H | D | R | |
| ATE | 89 | 3.86 | 0.028 | 0.14 | 32 | 2.90 | 0.058 | 0.16 | 15 | 1.94 | 0.17 | 0.29 |
| BORS | 9 | 2.08 | 0.141 | 0.05 | 19 | 2.61 | 0.10 | 0.13 | 36 | 3.00 | 0.058 | 0.16 |
| CEURN | 99 | 3.71 | 0.036 | 0.19 | 75 | 3.87 | 0.020 | 0.12 | 25 | 2.87 | 0.04 | 0.11 |
| CEURS | 98 | 3.82 | 0.032 | 0.17 | 85 | 3.88 | 0.024 | 0.13 | 54 | 3.42 | 0.036 | 0.14 |
| EEURMU | 57 | 3.53 | 0.035 | 0.08 | 36 | 3.79 | 0.035 | 0.09 | 63 | 3.76 | 0.025 | 0.10 |
| EEURSU | 66 | 3.75 | 0.026 | 0.11 | 31 | 2.99 | 0.013 | 0.13 | 68 | 3.87 | 0.019 | 0.08 |
| MDAP | 65 | 3.44 | 0.042 | 0.18 | 28 | 2.98 | 0.033 | 0.11 | 41 | 3.17 | 0.05 | 0.15 |
| MDBLK | 70 | 3.44 | 0.043 | 0.19 | 34 | 3.03 | 0.039 | 0.14 | 35 | 3.16 | 0.032 | 0.11 |
| MDIB | 70 | 3.59 | 0.036 | 0.15 | 28 | 2.83 | 0.056 | 0.15 | 35 | 3.29 | 0.031 | 0.07 |
| PNTCA | 66 | 3.72 | 0.029 | 0.11 | 27 | 3.00 | 0.024 | 0.09 | 18 | 2.66 | 0.081 | 0.08 |
| WEUR | 112 | 3.86 | 0.031 | 0.18 | 107 | 3.88 | 0.029 | 0.17 | 70 | 3.62 | 0.041 | 0.15 |
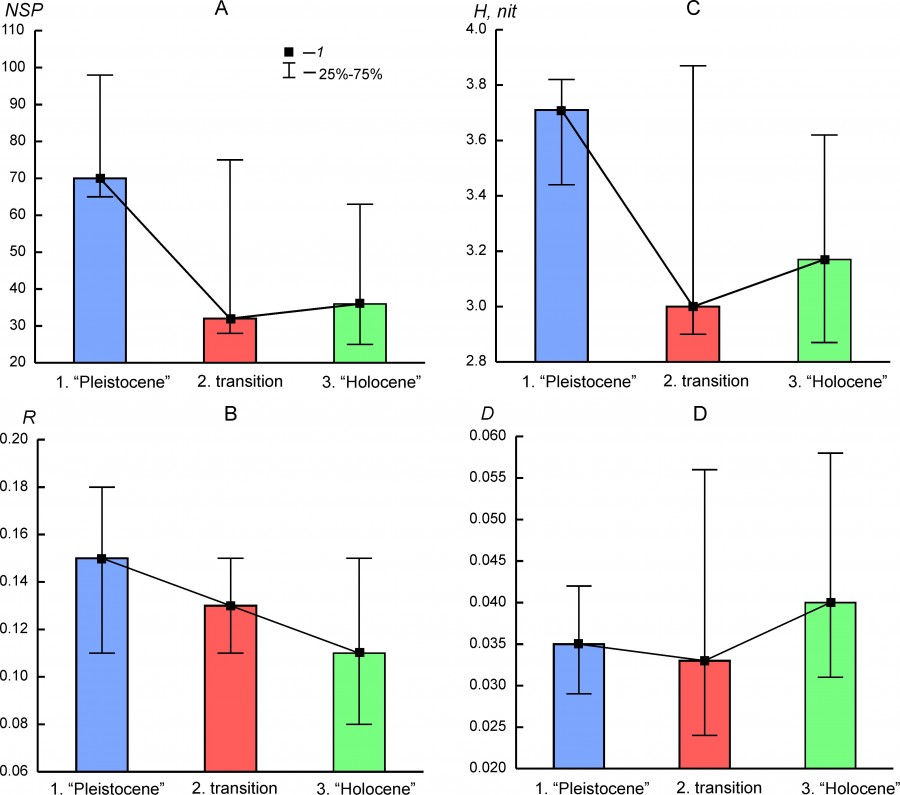
Fig. 5. Median (1) and interquartile range (25%–75%) of the biodiversity parameters for the different states of regional mammalian assembleges (1.“Pleistocene”, 2. transition, 1. “Holocene”). A – species richness (NSP), B – index of organization (R), C – entropy (H), D – dominance index (D)
Not in all the regional complexes the above-described temporal trends of diversity parameters are evident. The species richness of the BORS region in the Holocene was 4 times higher than in the Pleistocene. The increase in the diversity of the complex was accompanied by an increase in the R parameter and a decrease in the D parameter (Table 3). The species richness of the south Urals region in the Pleistocene was not higher than that in the Early and Middle Holocene, but the measure of organization and the dominance index in the Holocene were significantly lower. The diversity parameters of the middle Urals complex (EEURMU) are slightly different for the Pleistocene and Holocene states. The highest R value was observed for the ATE complex in the Holocene with very low entropy, low species richness, and a high dominance index (Table 3).
The “species turnover” index reflects the rate of change in the qualitative composition of faunal complexes between the Pleistocene – transition – Holocene states (Table 4, Fig. 6). On average, changes in the composition of the complexes were slightly larger during their transition to the Holocene state than between the Pleistocene state and the transitional state. At the median level of the index, these differences do not look significant.
Table 4. “Species turnover" index for different states of regional mammalian assemblages
| Region | Condition of the complex | |||
| "Pleistocene" – transient |
transient– "Holocene" |
"Pleistocene" – transient – "Holocene" |
"Pleistocene" – "Holocene" | |
| ATE | 0.488 | 0.447 | 0.882 | 0.712 |
| BORS | 0.643 | 0.418 | 0.961 | 0.733 |
| CEURN | 0.149 | 0.551 | 0.626 | 0.645 |
| CEURS | 0.169 | 0.352 | 0.506 | 0.408 |
| EEURMU | 0.290 | 0.313 | 0.558 | 0.233 |
| EEURSU | 0.381 | 0.394 | 0.691 | 0.239 |
| MDAP | 0.398 | 0.362 | 0.694 | 0.358 |
| MDBLK | 0.346 | 0.333 | 0.318 | 0.486 |
| MDIB | 0.429 | 0.302 | 0.688 | 0.390 |
| PNTCA | 0.419 | 0.778 | ~ 1.0 | 0.690 |
| WEUR | 0.132 | 0.279 | 0.405 | 0.297 |
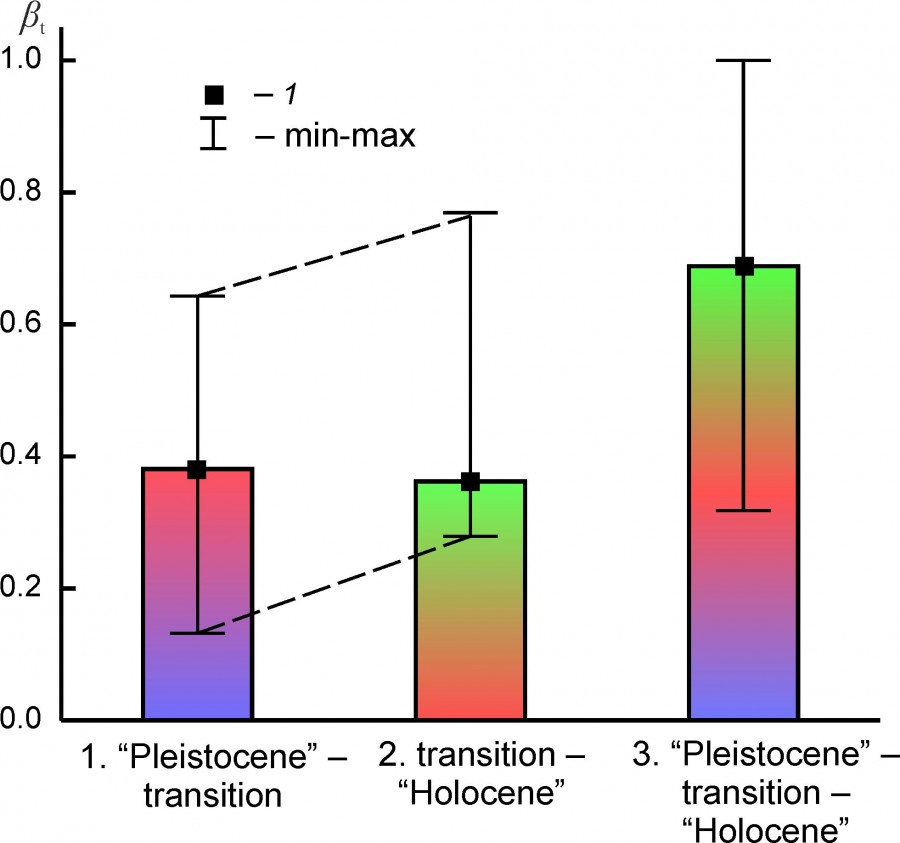
Fig. 6. Median (1), the minimum and maximum values (min – max) of the “species turnover” index (βt) between the states of regional mammalian assambleges (1. “Pleistocene” - transition, 2. transition – “Holocene” and 3. “Pleistocene”– transition – “Holocene”)
The species composition of regional faunas at the Pleistocene-Holocene boundary has changed on average by ~ 68%. When comparing the states of complexes in the “Pleistocene” and “Holocene” not considering the transitional period, this value is significantly lower, ~ 47%. Сomplexes EEURMU, EEURSU, WEUR, MDAP (βt: 0.233–0.358) underwent relatively weak changes in the composition, and complexes PNTCA, BORS, and ATE (βt: 0.690–0.733) - the most radical ones (Table 4).
The absolute value of the β ranking parameter decreases in a series of Pleistocene – transition – Holocene states (Fig. 7A). In general, this tendency of the changes in the shape of rank distributions correlates well with downward trend of organization of faunal complexes structure and species richness decline.
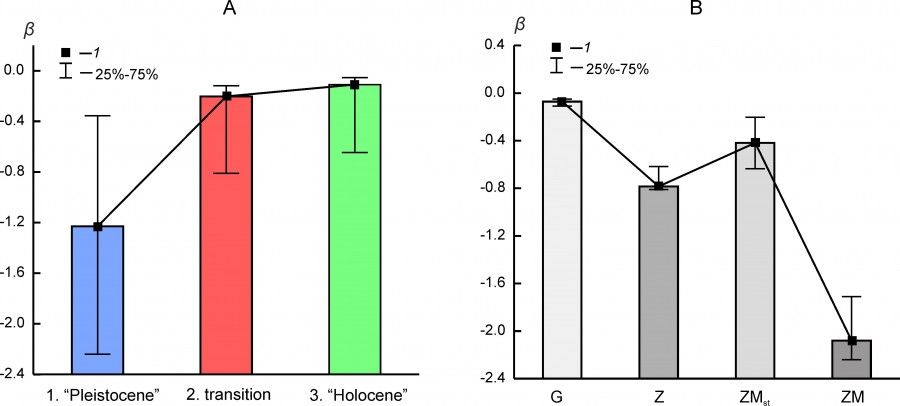
Fig. 7. Median (1) and interquartile range (25–75 %) of β parameter of rank distributions (А) for the different states of regional mammalian assemblages (1 – “Pleistocene”, 2 – transition, 3 – “Holocene”) and (Б) for different types of rank distribution models (G, Z, ZM, ZMst)
Figures 2D-2F, 3D-3F, 4B, and 4D show graphs of empirical rank distributions (points) and their best approximations (Table 5) by model rank distributions (lines) for different states of faunal complexes. The greater the differences in the geometry of the distributions, the more pronounced the differences in the structure of the complexes themselves at the considered stages of their evolution.
The value of β parameter depends on the type of rank distribution, although for the same distribution variant it can vary over a wide range (Fig. 7B). Distributions of the ZM or ZMst type most often characterize faunal complexes in the Pleistocene state (Table 5). The exception includes the northern complex BORS and two Urals complexes – EEURSU, EEURSU. The parameter β for distributions of the ZM type ranged from -2.25 (PNTCA) to -0.355 (MDAP). In the first case, the rank distribution is oblate (Fig. 2D), without pronounced dominance of the localities with the most common species (kabaloid horse, saiga, primitive bison, red deer, European donkey, steppe pestle, etc.) and with a short «tail» of the species found singly (wolverine, Eversmann hamster, etc.). The corresponding MDAP distribution has S-like shape (Fig. 4C) and is characterized by a relatively pronounced dominance of a few species (red deer, wild boar, wild ox, roe deer, mountain goat, European brown hare, etc.) and a “tail” of exotic or rare for the region species (narrow-skulled vole, red wolf, etc.). Rank distributions of G type (Fig. 4D) are characterized by a smooth decrease in the frequency of species occurrence and a relatively short “tail” of rare taxa.
At the transitional stage, the regional complexes MDIB, MDAP, PNTC change the type of ranking distribution from ZM to G. This change probably reflects a simplification of the complexes structure and ecological relations of species with the environment, and a decrease in overall stability. In the EEURSU region, formally, the ranking distribution corresponds to the Z model. For the transitional state of the complex (estimated by the dynamics of BC2) in total 31 species were recorded, at that 22 species singly, 8 species twice, and one (marmot) three times (Fig. 4D). Thus, in fact, taking into account the low value of r2 (Table 5), this ranking distribution cannot be described by any of the considered models, and the state of the system is interpreted as highly unsteady.
Table 5. A type of rank distribution (DSTR) and its parameter β, reproduced variance (r2)
| Region | Condition of the complex | ||||||||
| "Pleistocene" | transitional | "Holocene" | |||||||
| DSTR | β | r2 | DSTR | β | r2 | DSTR | β | r2 | |
| ATE | ZM | -1.92 | 0.975 | ZMst | -0.253 | 0.988 | Z | -1.181 | 0.966 |
| BORS | Z | -0.617 | 0.809 | Z | -0.810 | 0.981 | G | -0.110 | 0.986 |
| CEURN | ZM | -2.24 | 0.995 | ZMst | -0.152 | 0.968 | Z | -0.079 | 0.938 |
| CEURS | ZM | -1.43 | 0.988 | ZMst | -0.625 | 0.994 | ZMst | -0.646 | 0.986 |
| EEURMU | G | -0.073 | 0.979 | G | -0.069 | 0.992 | G | -0.044 | 0.979 |
| EEURSU | G | -0.046 | 0.976 | Z | -0.347 | 0.800 | G | -0.046 | 0.957 |
| MDAP | ZMst | -0.355 | 0.996 | G | -0.073 | 0.946 | G | -0.109 | 0.968 |
| MDBLK | ZMst | -1.23 | 0.979 | ZM | -1.19 | 0.978 | G | -0.065 | 0.938 |
| MDIB | ZMst | -0.481 | 0.995 | G | -0.118 | 0.979 | G | -0.054 | 0.942 |
| PNTCA | ZM | -2.25 | 0.983 | G | -0.038 | 0.731 | G | -0.129 | 0.996 |
| WEUR | ZM | -1.71 | 0.972 | ZMst | -0.132 | 0.956 | Z | -0.759 | 0.966 |
The CEURS, CEURN, ATE, and WEUR complexes passed from the "equilibrium" to the "stationary" state, accompanied by a decrease in the absolute values of β. The distribution for the regional complex MDB formally retained the model type of ZM rank with a slight decrease in the parameter β. The changes affected the first ranks taxa (mountain goat, red deer, wild boar), the frequency of occurrence with which increased significantly (Fig. 2F).
The transition of regional complexes from the Pleistocene state to the Holocene state was expressed in the change of the dominant type of rank distribution (Table 5). The predominance of the type G distribution with the parameter β from -0.129 to -0.044 in combination with a decrease in the organization indicates a simplification of the structure of the regional complexes MDAP, MDIB, MDBLK, and PNTCA, which was outlined at the previous, transitional stage. For the regional complexes ATE, CEURN, and WEUR, change of the stationary variant ZM distribution to the Z distribution is not essential from the point of view of the “species” – “resource” relations, but reflects only a decrease in species richness and/or an increase in the dominance index and an increase in the absolute values of the parameter β. The complex of Central European region CEURS did not change its structure according to the parameters of rank distribution.
The data on the change in time parameters of the diversity of regional mammalian complexes were given above. The same data allow testing the hypothesis about the existence of a spatial pattern of their variability. The hypothesis suggests that some part of the dispersion of the diversity parameters is determined by the geographical location of the regions. To test the hypothesis, we applied the principal component analysis for the standardized parameters of biological diversity (H, D, R, β, βt) (Fig. 8A). The projection of regional complexes on PC1 and PC2 and their classification by the UPGMA method for the first three main components (metric – Euclidean distance) (Fig. 8B) showed the presence of three geographical groups of regions (Fig. 1): 1) the Mediterranean group (MDIB, MDAP and MDBLK); 2) the West-Central-European group (WEUR, CEURN and CEURS); 3) the Urals group (EEURMU and EEURSU). Three regional complexes (ATE, BORS and PNTCA) demonstrate the uniqueness of the biological diversity parameters, and their variability reflects the fundamental changes in the regional mammalian fauna at the turn of the Pleistocene and Holocene (Tables 3–5).
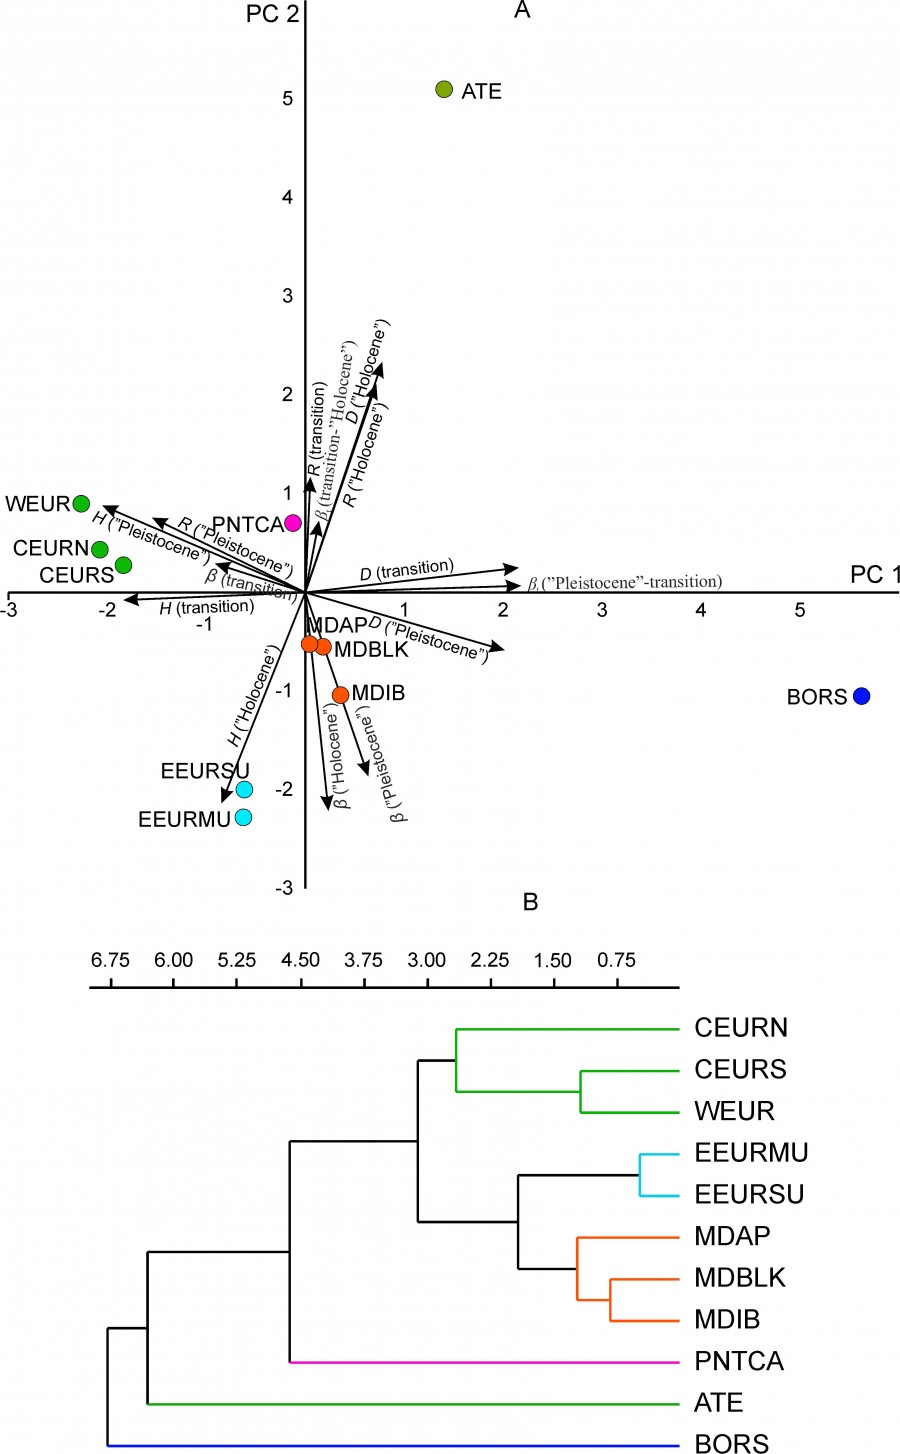
Fig. 8. The relative position of regional mammalian complexes. А – projection on the first principal components (PC1, PC2); the projections of parameters of biological diversity are shown (H, D, R, β, βt ), Б – UPGMA tree based on three principal components (PC1, PC2, PC3); cophenetic correlation 0.95
Discussion
Modeling the dynamics of the faunal composition allowed us to establish that the transformation of the regional mammalian complexes of Europe on the Pleistocene-Holocene boundary occurred asynchronously in different parts of the subcontinent in the interval from about 18 to 6.6 thousand years ago. The duration of the transitional state of faunal complexes varied from ~ 1 to 5.6 thousand years (on average, about 3 thousand years). Thus, in each region where this process was clearly expressed, we can talk about very short time intervals. On the scale of the history of these complexes in the Late Pleistocene (from the end of the fifth marine isotope stage to the end of the maximum of the last glaciation, 74 – 16 thousand years ago), the time of a qualitative change in their composition averaged about 5% of their existence.
The evolution of the complexes of the Apennine Peninsula (MDAP) and the southern Urals occurred without a pronounced transitional period. In the MDAP region, the main transformation, which can be considered as an analogue of the transitional state of faunal complexes in other regions, occurred earlier, at the maximum of the last glaciation (Fig. 4A). In the southern Urals, the faunal complex did not undergo any qualitative rearrangements at the end of the late Pleistocene. The peculiarity of the evolution of these complexes is due primarily to their geographical location. The evolution of the MDAP complex was influenced by the “island effect”, which was expressed in the depletion of fauna at the maximum of the last glaciation (Puzachenko, Markova, 2019) and limiting immigration in the Late Glacial and Early Holocene. The special position of the South Urals complex (EEURSU) on the border of European and Siberian faunas provided this region with the role of a refugium for species with very different ecological niches. At the end of the Pleistocene, its composition was enriched by some representatives of the Asian fauna and forest species (weasel, chipmunk, squirrel, etc.).
Changes in the global climate acted as the main driver of the evolution of the regional faunal structure. It is significant that the temperature increase was generally unfavorable for the Late Pleistocene mammalian complexes, which is reflected in different signs of the correlation coefficients of the BC1 coordinate with the variables δ18O ("+") and NSP ("-"). An exception is the northernmost region (BORS), which range was partially overlapped by the Scandinavian glacier (Fig. 1). Therefore, it is natural that warming was a prerequisite for the growth of species diversity there. In other cases, in the territory of Western, Central, and Eastern Europe there was a disintegration of disharmonious regional faunas, the core of which were cold-tolerant and xerophilic species of open spaces, primarily herbivorous mammals.
The “species turnover” index shows the degree of renewal of fauna composition due to two processes – extinction and immigration. Comparison of the Holocene and Pleistocene states of the regional complexes showed that the regions of the southern and middle Urals, as well as the West European region, can be considered as a refugiums of the Pleistocene fauna states of regional complexes showed that the regions of the southern and middle Urals as well as the Western European region can be considered as refugiums of Pleistocene fauna (without considering the modern anthropogenic transformation of these territories). In them, the "turnover" of species was not more than 30%. In the vast majority of regions, a decrease in species richness was observed, which indicates the predominance of the extinction of species. The only exceptions are the Urals regions and the northernmost region considered by us – BORS.
The parameters of biological diversity (H, D, R) demonstrate varying degrees of sensitivity to changes in the evolutionary state of faunal complexes
Entropy (H), in accordance with the dependence on the number of elements in the “system” (Foerster, 1960), strictly positively correlates with the logarithm of the number of detected taxa (general dependence: H = 0.31 + 1.82 · log10 (NSP), r = 0.934, p<0.00001). This relationship determines the low diversity of faunal complexes in the Holocene compared to the Pleistocene. At the level of a stable trend, note a negative correlation of H with the dominance index D (k = -0.66, p<0.0001). This dependence reflects a tendency toward polydominancy in complexes with high species richness.
The organization parameter (R) has important theoretical significance. Recall that there is a direct biological application of the redundancy measure, for example, to the linear genetic code when in a DNA molecule from 1 to 6 triplets of nucleotides correspond to one encoded amino acid. Such triplets, by analogy, are called synonyms. As is known, substitutions of synonymous triplets (mutations) do not lead to changes in the structure of the encoded protein. Redundancy at the level of elements, functional relationships, etc., is a necessary condition for stability at the system level, not only in the context of information transfer. This principle can be extended, by analogy, to a community of organisms, in which, for example, many species live together with relatively narrow and overlapping ecological niches (functional redundancy) and effectively use limited resources together. The irreversible or temporary loss of one or more of these species will not result in noticeable changes in the functioning of the community as a whole in terms of resource use and food chain structure by expanding or shifting the niches of the remaining species.
Numerous studies of the relative content of nitrogen and carbon isotopes (d15N, d13С) in the bone tissues of Pleistocene mammals show a high stability of food niches of mega fauna (cave bear, mammoth, woolly rhinoceros, bison) in the Late Pleistocene and in different regions of the Holarctic (Kuitems et al., 2019; Schwartz-Narbonne et al., 2019 and many others). In particular, the work (Schwartz-Narbonne et al., 2019) substantiates the hypothesis of functional ecological redundancy of the “mammoth steppe” ecosystem (resilient system model). At the same time, some species of the faunal complex (horse, reindeer, saiga) demonstrate the ability to change the food niche depending on conditions, demonstrating ecological plasticity (dietary flexibility).
Our data demonstrate a relatively high organization of mammalian faunal complexes in the Pleistocene. Note that R does not correlate with either NSP or H, i.e. it is an independent parameter of diversity. Since the transitional period, a decrease in the parameter R occurred in many regional mammalian complexes. Reduction of organization in Holocene complexes implies: simplification of ecological relations, predominance of species with wide ecological niches, reduction of functional redundancy, and, as a result, reduction of stability. On the other hand, such complexes have a rather high recovery potential after a destructive effect.
In the context of the hypothesis of functional redundancy, the phenomenon of the Urals regions in which mammalian complexes exhibit steadily low values of the parameter R (0.08 - 0.13) is interesting. Their stability was probably supported not so much due to the processes of self-organization and interactions between species, but due to the high patchiness and diversity of habitats. The latter is typical of mountain ecosystems, but in this case, the geographical position of the regions and the meridional stretch of the mountain system of the Urals are also important. The combination of these conditions provides habitat in a relatively small area of steppe, forest-steppe and forest species both cold-tolerant, and to varying degrees thermophilic.
In conclusion, it should be noted that the parameter R plays an important role in the classification of systems and their dynamics, regardless of their nature. For example, regional complexes of mammals for which RR> ~ 0.11 they belong to the category of “quasi-determined systems” (Крамаренко, 2005). Values of R> 0.31 for natural (not created by humans) complex systems are unlikely, and higher values of the parameter rather indicate the presence in the sample of elements belonging to two or more different systems.
The parameters of the rank distribution of locations occurrence frequencies of different mammalian species are coefficients, the number of which varies from two to four. In this study, we used only one of them – the parameter -β. The value 1/|-β| in the “thermodynamic interpretation” of the community is proportional to the “temperature” of the system (Bulgakov, Levich, 2005; Puzachenko Yu., 2016). The smaller the absolute value of β, and respectively, the higher the “temperature”, the less pronounced the contribution of a taxon of the first rank to the rank distribution, and the higher the contribution of “ordinary” and “rare” taxa (more oblate distribution). The value of β depends on the distribution model. In accordance with the approach of A.P. Levich, in the case of a linear relationship between the occurrence of a “species” and the volume of the hypothetical “resource” consumed by it (G distribution), β is usually less than in the case of non-linear (logarithmic) relationship between them (Z and ZM type distributions). It can be assumed that in unstable (“hot”) systems with low R values and with stochastic dynamics of state change, the absolute value of β will be lower than in more stable (“cold”) systems with more determined dynamics and high organization. Thus, the parameter β can contain generalized information on the dominant environmental relations in the community and can be used as one of the “indices” of species diversity. For most regional mammalian complexes in the Pleistocene, the parameter β was lower (higher in absolute value) than in the Holocene. This empirical fact corresponds to the content of the hypothesis about their stability and high organization. Moreover, the variability of β does not correlate with other parameters, i.e. contains an independent component of information on the phenomenon of biological diversity.
Rank distributions of G, Z, and ZM characterize a hypothetical system in equilibrium (by the condition of mathematical derivation of these models under the assumption that the system is equilibrium and all derivatives are equal to zero and entropy is maximal (Puzachenko Yu., 2016)). Therefore, in the case of good statistical coincidence of the real distribution with these models, it can be assumed that in the simulated community of organisms during the “observation period” there are no processes that change the type of relationship between species and environmental resources. Modifications of the “stationary” state model suggest a decrease in the entropy of the system at derivatives not much different from 0. From this point of view, regardless of the type of rank distribution, most of the regional faunal complexes of mammals are either in relatively equilibrium (more often) or in a stationary state on the considered space-time scales. The scale in this work is determined by the size of the geographical region and the time interval fixed for each of the three states. The Urals regions EEURSU and EEURSU are exceptions, in which high amplitude of fluctuations of the structural parameters reflected in the dynamics of the first coordinate of regional models (BC1, Fig. 4F) was noted. These reversible fluctuations occurred around a rather wide range of BC1 values, without a pronounced trend.
We showed that there is a geographical pattern in the temporal variability of the biodiversity parameters of regional faunal complexes of the second half of the Late Pleistocene and the first half of the Holocene. The bioregions themselves were identified as a result of the analysis of modern mammalian areas, the configuration of which for species that survived the Pleistocene – Holocene boundary changed significantly compared to the past. The fact of geographical ordering of regions based on the parameters of the biological diversity of fossil faunal complexes indirectly confirms our hypothesis about the relative invariance of their borders in the Holocene - the late Pleistocene in Europe (Markova et al., 2008).
Concluding the discussion of the results, we will focus on some limitations associated with the use of biological diversity parameters. Basically, they represent the dependence of the result on the selected space-time scale of the study. The dependence of diversity parameters (for example, species richness and entropy) on the sample size or the studied area is a well-known empirical regularity that has good theoretical justification. We assume that a similar in nature dependence will be observed in the analysis of paleontological material. At least, on the basis of the data underlying this work, it can be assumed that there is a nonlinear correlation between the length of the time interval and the number of found species with the output of the corresponding curve on the “plateau”. These limitations pose the problem of “representativeness” of the initial data when evaluating diversity parameters. Also, a change in the spatial scale of the study can significantly affect the parameters of the model of the structure dynamics of the studied “system” (the number of coordinates, a change in the leading control external variables). This effect is due to the hierarchical organization of natural systems (Puzachenko, 2017). For example, from the fact that the leading role of the global climate dynamics as a factor limiting the variability of species richness has been proved at the level of the “large region”, it does not follow that this role will remain unchanged for individual intraregional sections. Similar restrictions apply to the time scale too.
Conclusions
The transformation of the structure of mammalian faunal complexes at the Pleistocene and Holocene boundary occurred at different times in different regions of Europe in the range of 18–6.6 thousand years ago and did not coincide with the stratigraphic boundary between the Pleistocene and Holocene (11.7 thousand years ago).
The duration of the transitional state of faunal complexes varied from ~ 1 to 5.6 thousand years (on average, about 3 thousand years).
Three variants of the evolution of faunal complexes are distinguished: 1) with a sharp reorganization of the fauna in rather short terms, 2) with gradual directed transformation stretched in time, and 3) without essential changes in the structure of the complexes.
The leading external factors in varying the species richness and structure of the mammalian fauna were changes in the global climate.
The main changes in the structure of faunal complexes were expressed in the reduction of species richness/diversity and simplification of the internal structure.
The functional redundancy of most European faunal complexes in the Holocene is lower than in the Pleistocene, which suggests their relatively low resistance to external factors, but also a relatively high self-healing ability.
The stability of the faunal complexes of the Middle and Southern Urals is maintained not so much due to self-organization processes at the ecosystem level, but due to the high patchiness and diversity of mountain habitats.
The parameters of biological diversity used in the work, in combination with multi-dimensional dynamics models and models of rank distributions, for the first time made it possible to carry out a meaningful macroscopic description of evolutionary rearrangement patterns of regional European faunas at the Pleistocene and Holocene boundary and their comparative analysis.
References
Álvarez-Lao D. J., Méndez M. Latitudinal gradients and indicator species in ungulate paleoassemblages during the MIS 3 in W Europe, Palaeogeography, Palaeoclimatology, Palaeoecology. 2016. No. 449. P. 455–462.
Andersen K. K., Azuma N., Barnola J. M., Bigler M., Biscaye P., Caillon N., Chappellaz J., Clausen H. B., Dahl-Jensen D., Fischer H., Fluckiger J., Fritzsche D., Fujii Y., Goto-Azuma K., Gronvold K., Gundestrup N. S., Hansson K, M., Huber C., Hvidberg C. S., Johnsen S. J., Jonsell U., Jouzel J., Kipfstuhl S., Landais A., Leuenberger M., Lorrain R., Masson-Delmotte V., Miller H., Motoyama H., Narita H., Popp T., Rasmussen S. O., Raynaud D., Rothlisberger R., Ruth U., Samyn D., Schwander J., Shoji H., Siggard-Andersen M, L., Steffensen J. P., Stocker T., Sveinbjornsdottir A. E., Svensson A., Takata M., Tison J, L., Thorsteinsson T., Watanabe O., Wilhelms F. & White J. W. C. High-resolution record of Northern Hemisphere climate extending into the last interglacial period, Nature. 2004. Vol. 431 (7005). P. 147–151.
Bachura O., Kosintsev P. Late Pleistocene and Holocene small- and large-mammal faunas from the Northern Urals, Quaternary International. 2007. Vol. 160. P. 121–128.
Bazzaz F. A. Plant Species Diversity in Old-Field Successional Ecosystems in Southern Illinois, Ecology. 1975. Vol. 56 (2). (Early Spring, 1975). P. 485–488.
Bir S. Cybernetics and production management. M.: Fizmatgiz, 1963. 275 p.
Bray J. R., Curtis J. T. An ordination of the upland forest communities of southern Wisconsin, Ecological Monographs. 1957. Vol. 27. P. 325–349.
Bulgakov N. G. Levich A. P. Description, origin and application of rank distributions in community ecology, Vestnik Moskovskogo universiteta. 2005. Ser. 16. Biologiya. No. 1. P. 18–24.
Crees J. J., Carbone C., Sommer R. S., Benecke N., Turvey S. T. Millennial-scale faunal record reveals differential resilience of European large mammals to human impacts across the Holocene, Proceedings of the Royal Society of London B. 2016. Vol. 283. DOI: doi.org/10.1098/rspb.2015.2152
Danukalova G. A. Yurin V. I. Kosincev P. A. Osipova E. M. Kurmanov R. G. Biostratigraphical investigations of Upper Pleistocene and Holocene sediments of the cave Sikiyaz-Tamak 7 (South Urals, Russia), Geologicheskiy vestnik. 2018. No. 1. P. 144–161.
Davison M. L. Introduction to Multidimensional Scaling and Its Applications, Applied Psychological Measurement. 1983. Vol. 7. P. 373–379.
Dinnis R., Pate A., Reynolds N. Mid-to-late Marine Isotope Stage 3 mammal faunas of Britain: a new look, Proceedings of the Geologists’ Association. 2016. Vol. 127. P. 435–444.
Discamps E., Royer A. Reconstructing palaeoenvironmental conditions faced by Mousterian hunters during MIS 5 to 3 in southwestern France: A multi-scale approach using data from large and small mammal communities, Quaternary International. 2017. Vol. 433. P. 64–87.
Fernández-García M., López-García J. M., Lorenzo C. Palaeoecological implications of rodents as proxies for the Late Pleistocene-Holocene environmental and climatic changes in northeastern Iberia, Comptes Rendus – Palevol 2016. Vol. 15. P. 707–719.
Foerster von H. On self-organizing systems and their environments, The Interdisciplinary Symposium on Self-Organizing Systems, May 5, 1959, Chicago, Illinois, Yovits M. C., Cameron S. (eds.). Self-Organizing Systems. London: Pergamon Press, 1960. P. 31–50.
Hammer Ø., Harper D. A. T., Ryan P. D. PAST: paleontological statistics software package for education and data analysis, Palaeontologia Electronica. 2001. Vol. 4. P. 1–9.
Heikinheimo H., Fortelius M., Eronen J., Mannila H. Biogeography of European land mammals shows environmentally distinct and spatially coherent clusters, Journal Biogeography. 2007. Vol. 34. P. 1053–1064.
Hubbell S. P. The unified neutral theory of biodiversity and biogeography. Princeton: Princeton Univ. Press, 2001. 375 p.
Hutchinson G. E. Concluding remarks, Cold Spring Harbor Symposia on Quantitative Biology. 1957. Vol. 22 (2). P. 415–427.
Kosintsev P. A., Gasilin V. V., Gimranov D. O., Bachura O. P. Carnivores (Mammalia, Carnivora) of the Urals in the Late Pleistocene and Holocene, Quaternary International 420. 2016. P. 145–155.
Kramarenko S. S. The method of using entropy-information analysis for quantitative traits, Izvestiya Samarskogo nauchnogo centra RAN. 2005. T. 7 (1). P. 242–247.
Kreft H., Jetz W. A framework for delineating biogeographical regions based on species distributions, Journal Biogeography. 2010. Vol. 37. P. 2029–2053.
Kuitems M., Kolfschotena T. van, Tikhonovd A. N., Plichta J. van der. Woolly mammoth δ13C and δ15N values remained amazingly stable throughout the last ∼50,000 years in north-eastern Siberia, Quaternary International. 2019. Vol. 500. P. 120–127.
Levich A. P. Description, origin and application of rank distributions in community ecology, Obschaya i prikladnaya cenologiya. 2007. No. 5. P. 14–19.
Levich A. P. Information as a system structure, Semiotika i informatika. 1978. T. 10. P. 116–132.
Levich A. P. The structure of ecological communities. M.: Izd-vo Mosk. un-ta, 1980. 180 p.
Magurran A. E. Measuring biological diversity. Oxford: Blackwell Publishing, 2004. 256 p.
Mandel'brot B. Information theory and psychological theory of layer frequency, Matematicheskie metody v social'nyh naukah. M.: Progress, 1973. P. 326–337.
Margalef R. Information theory in ecology, Memorias de la Real Academia de Ciencias y Artes de Barcelona. 1957. Vol. 23. P. 373–449.
Markova A. K. Kol'fshoten T. Bohnkke Sh. Kosincev P. A. Mol I. Puzachenko A. Yu. Simakova A. N. Smirnov N. G. Verpoorte A. Golovachev I. B. Evolution of ecosystems in Europe during the transition from Pleistocene to Holocene. (24–8 typ. l. n.), Otv. red. A. K. Markova, T. van Kol'fshoten. M.: Tovarischestvo nauchnyh izdaniy KMK, 2008. 556 p.
Markova A. K. Puzachenko A. Yu. Reconstruction of changes in paleoenvironment in the Kostenok area and adjacent territories during the Late Pleistocene according to mammals, Estestvenno-nauchnye metody v izuchenii i sohranenii pamyatnikov Kostenkovskogo-Borschevskogo arheologicheskogo rayona. Voronezh: Voronezhckiy universitet, 2017. P. 48–57.
Markova A. K., Puzachenko A. Y., Kolfschotena T. van. The North Eurasian mammal assemblages during the end of MIS 3 (Brianskian-Late Karginian-Denekamp Interstadial), Quaternary International 2010. Vol. 212. P. 149–158.
Markova A. K., Smirnov N. G., Kozharinov A. V., Kazantseva N. E., Simakova A. N., Kitaev L. M. Late Pleistocene distribution and diversity of mammals in Northern Eurasia (PALEOFAUNA database), Paleontologia i Evolucio. 1995. Vol. 28/29. P. 5–143.
Markova A., Puzachenko A. Preliminary Analysis of European Small Mammal Faunas of the Eemian Interglacial: Species Composition and Species Diversity at a Regional Scale, Quaternary. 2018. Vol. 1 (9). DOI: doi:10.3390/quat1020009
Marquet P. A. Invariants, scaling laws, and ecological complexity, Science. 2000. Vol. 289. No. 5484. P. 1487–1488.
Marquet P. A. Scaling and power-laws in ecological systems, Journal of Experimental Biology. 2005. Vol. 208. P. 1749–1769.
McGill B. J., Etienne R. S., Gray J. S., Alonso D., Anderson M. J., Benecha H. K., Dornelas M., Enquist B. J., Green J. L., He F., Hurlbert A. H., Magurran A. E., Marquet P. A., Maurer B. A., Ostling A. S., Candan U. U., Ugland K. I., White E. P. Species abundance distributions: moving be yond single prediction theories to integration within an ecological framework, Ecology Letters. 2007. Vol. 10. P. 995–1015.
Mourelle C., Ezcurra E. Differentiation diversity of Argentine cacti and its relationship to environmental factors, Journal of Vegetation Science. 1997. Vol. 8. P. 547–558.
Pavelková Řičánková V., Robovský J., Riegert J., Zrzavý J. Regional patterns of postglacial changes in the Palearctic mammalian diversity indicate retreat to Siberian steppes rather than extinction, Scientific Reports. 2015. Vol. 5. DOI: doi.org/10.1038/srep12682
Puzachenko A. Yu., Markova A. K. Diversity dynamics of large- and medium-sized mammals in the late Pleistocene and the Holocene on the east European Plain: systems approach, Quaternary International. 2016. Vol. 420. P. 391–401.
Puzachenko A. Yu., Markova A. K. Evolution of mammal species composition and species richness during the Late Pleistocene – Holocene transition in Europe: A general view at the regional scale, Quaternary International 2019. URL: https://doi.org/10.1016/j.quaint.2018.12.025 (data obrascheniya: 10.08.2019).
Puzachenko A. Yu., Markova A. K. Mammal diversity during the Pleistocene–Holocene transition in Eastern Europe, Integrative Zoology. 2014. Vol. 9. P. 461–470.
Puzachenko Yu. G. Biodiversity in biosphere: systemological and semantic analysis, Biosfera. 2009. T. 1 (1). P. 025–038.
Puzachenko Yu. G. Rank distributions in ecology and non-extensive thermodynamics, Aspekty bioraznoobraziya. Sbornik trudov Zoologicheskogo muzeya MGU. T. 54 (2). M.: Tovarischestvo nauchnyh izdaniy KMK, 2016. P. 401–830.
Puzachenko Yu. G. Theoretical and methodological basis of long-term ecologo-geographical investigations in the reserve territory, Voprosy geografii. 2017. T. 143. P. 192–233.
Puzachenko Yu. G. Thermodynamical basis of the doctrine of biosphere and noosphere(k 150-letiyu akademika V. I. Vernadskogo) , Izvestiya RAN. Ser. geograficheskaya. 2013. No. 4. P. 5–20.
Ramsey B. C., Lee Sh. Recent and planned developments of the program OxCal, Radiocarbon. 2013. Vol. 55. P. 720–730.
Reimer P. J., Bard E., Bayliss A., Beck J. W., Blackwell P. G., Ramsey C. B., Buck C. E., Cheng Edward H. L. R., Friedrich M., Grootes P. M., Guilderson T. P., Haflidason H., Hajdas I., Hatté C., Heaton T. J., Hoffmann D. L., Hogg A. G., Hughen K. A., Kaiser K. F., Kromer B., Manning S. W., Niu M., Reime, R. W., Richards D. A., Scott E. M., Southon J. R., Staff R. A., Turney C. S. M., Plicht J. van der. Intcal13 and Marine13 radiocarbon age calibration curves 0–50,000 years cal BP, Radiocarbon. 2013. Vol. 55. P. 1869–1887.
Ricotta C., Podani J. On some properties of the Bray-Curtis dissimilarity and their ecological meaning, Ecological Complexity. 2017. Vol. 31. P. 201–205.
Royer R. R., Montuire S., Legendre S., Discamps E., Jeannet M., Lécuyer Ch. Investigating the influence of climate changes on rodent communities at a regional-scale (MIS 1–3, Southwestern France), PLoS ONE. 2016. Vol. 11 (1). DOI: doi.org/10.1371/journal.pone.0145600
Schwartz-Narbonne R., Longstaffe F. J., Kardynal K. J. Druckenmiller P., Hobson K. A., Jass C. N., Metcalfe J. Z., Zazula G.. Reframing the mammoth steppe: Insights from analysis of isotopic niches, Quaternary Science Reviews. 2019. Vol. 215. P. 1–21.
Semken H. A. Jr. Environmental interpretations of the “disharmonious” Late Wisconsinian biome of South-eastern North America, Laub R. S., Miller N. G., Steadman D. W. (eds). Late Pleistocene and Early Holocene Paleoecology and Archeology of the Eastern Great Lakes Region, Bulletin of Buffalo Society of Natural Sciences. 1988. Vol. 33. P. 185–194.
Semken H. A. Jr., Graham R. W., Stafford T. W. Jr. AMS 14C analysis of Late Pleistocene non-analog faunal components from 21 cave deposits in southeastern North America, Quaternary International. 2010. Vol. 217. P. 240–255.
Shannon C. E. A mathematical theory of communication, Bell System Technical Journal. 1948. Vol. 27. P. 379–423, 623–656.
Simpson E. H. Measurement of diversity, Nature. 1949. Vol. 163. P. 688–690.
Smirnov N. G. Bol'shakov V. N. Kosincev P. A. Panova N. K. Korobeynikov Yu. I. Ol'shvang V. N. Erohin N. G. Bykova G. V. Historical ecology of animals of South Urals mountains. Sverdlovsk: UrO ANSSSR, 1990. 244 p.
Sokal R. R., Rohlf F. J. Biometry: The principles and practice of statistics in biological research. 3rd Edition. NY: W.H. Freeman and Co., 1995. 887 p.
Svendsen J. I., Alexanderson H, Astakhov V. I., Demidov I., Dowdeswell J. A., Svend F., Gataullin V., Henriksen M., Christian H., Houmark-Nielsen M., Hubberten H.W., Ingólfsson Ó., Jakobsson M., Kjær K. H., Larsen E., Lokrantz H., Lunkka J. P., Lyså A., Mangerud J., Matiouchkov A., Murray A., Möller P., Niessen F., Nikolskaya O., Polyak L., Saarnisto M., Siegert Ch., Siegert M.J., Spielhagen R. F., Stein R. Late Quaternary ice sheet history of northern Eurasia, Quaternary Science Reviews. 2004. Vol. 23 (11–13). P. 1229–1271.
Tokeshi M. Species abundance patterns and community structure, Advances in Ecological Research. 1993. Vol. 24. P. 111–187.
Torre D., Abbazzi L., Ficcarelli G., Masini F., Mezzabotta C., Rook L. Changes in mammal assemblages during the Lateglacial-eariiest Holocene, Il Quaternario: Italian Journal of Quaternary Sciences. 1996. Vol. 9. No. 2. P. 551–560.
Walker M., Johnsen S., Rasmussen S. O., Popp T., Steffensen J, P., Gibbard P., Hoek W., Lowe J., Andrews J., Bjӧrck S., Cwynar L. C., Hughen K., Kershaw P., Kromer B., Litt T., Lowe D. J., Nakagawa T., Newnham R., Schwander, J. Formal definition and dating of the GSSP (Global Stratotype Section and Point) for the base of the Holocene using the Greenland NGRIP ice core, and selected auxiliary records, Journal of Quaternary Science. 2009. Vol. 24. P. 3–17.
Acknowledgements
The study was carried out according to the program of the State assignment of the Institute of Geography of the Russian Academy of Sciences "Assessment of physical-geographical, hydrological and biotic changes in the environment and their consequences for creating the foundations of sustainable nature management" № 0148-2019-0007 (АААА-А19-119021990093-8).

 © 2011 - 2024